
FIGURE 1.
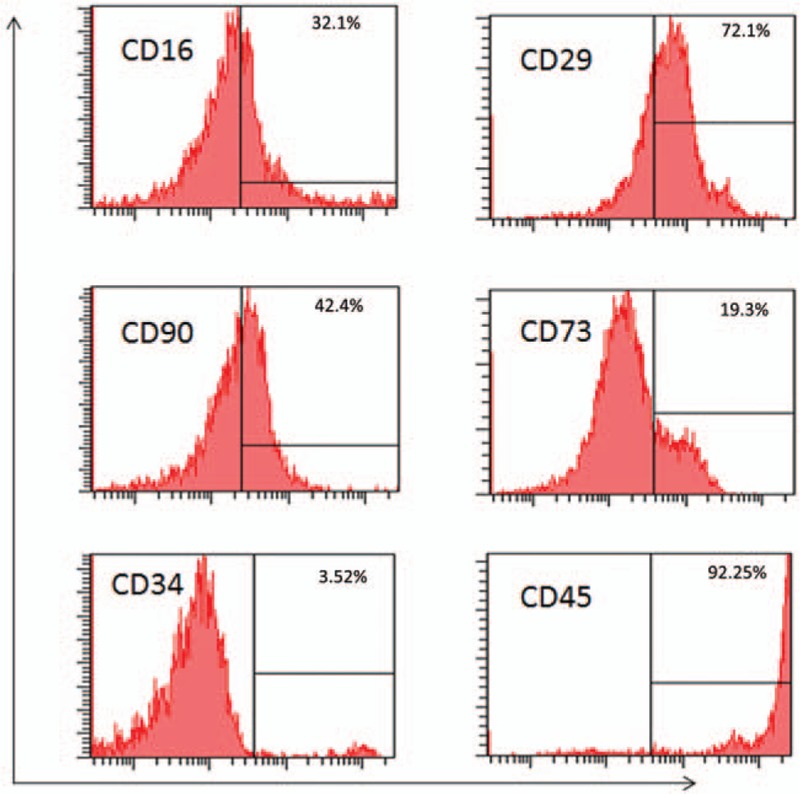
Flow cytometry analysis of the UC-MSCs. (A) Expression of surface markers of UC-MSCs. (B) The average rate of CD16, CD29, CD34, CD45, CD73, CD90. UC-MSCs, umbilical cord-derived mesenchymal stem cells.
Official websites use .gov
A
.gov website belongs to an official
government organization in the United States.
Secure .gov websites use HTTPS
A lock (
) or https:// means you've safely
connected to the .gov website. Share sensitive
information only on official, secure websites.
Flow cytometry analysis of the UC-MSCs. (A) Expression of surface markers of UC-MSCs. (B) The average rate of CD16, CD29, CD34, CD45, CD73, CD90. UC-MSCs, umbilical cord-derived mesenchymal stem cells.