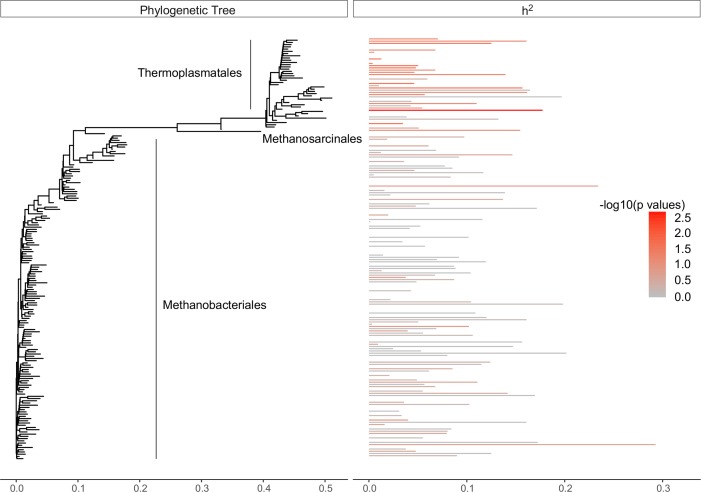
Fig 2. Phylogeny of 189 rumen archaeal OTU abundance.
Branch lengths represent substitution number per site calculated by FastTree2[81]. Heritability estimates (h2) for each OTU abundance is plotted with a horizontal bar and colored by taxonomic group classification.

