
Figure 1.
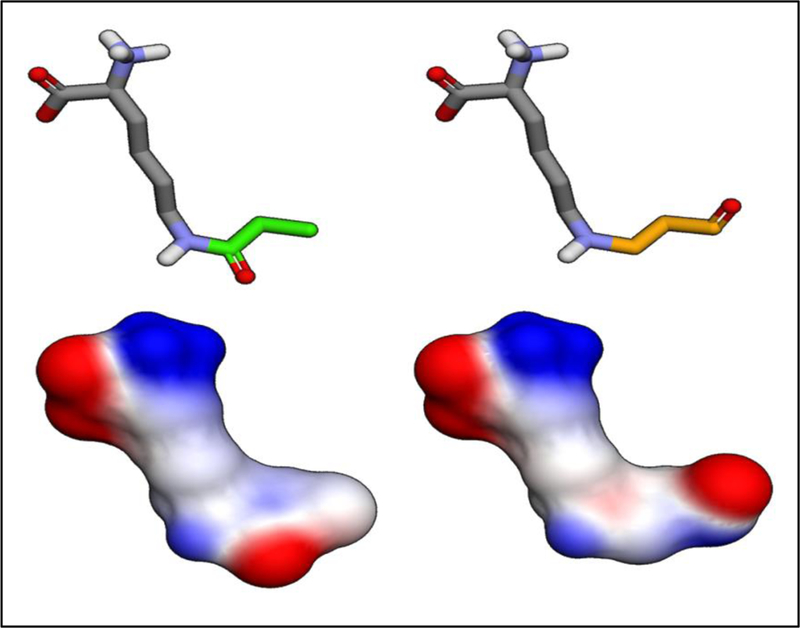
Lysine modified via propionylation (green) and acrolein (orange) illustrate isobaric PTMs (top). Elec-trophilic density maps show the impact each PTM has on amino acid charge-state dynamics (bottom).
Official websites use .gov
A
.gov website belongs to an official
government organization in the United States.
Secure .gov websites use HTTPS
A lock (
) or https:// means you've safely
connected to the .gov website. Share sensitive
information only on official, secure websites.
Lysine modified via propionylation (green) and acrolein (orange) illustrate isobaric PTMs (top). Elec-trophilic density maps show the impact each PTM has on amino acid charge-state dynamics (bottom).