
Figure 4.
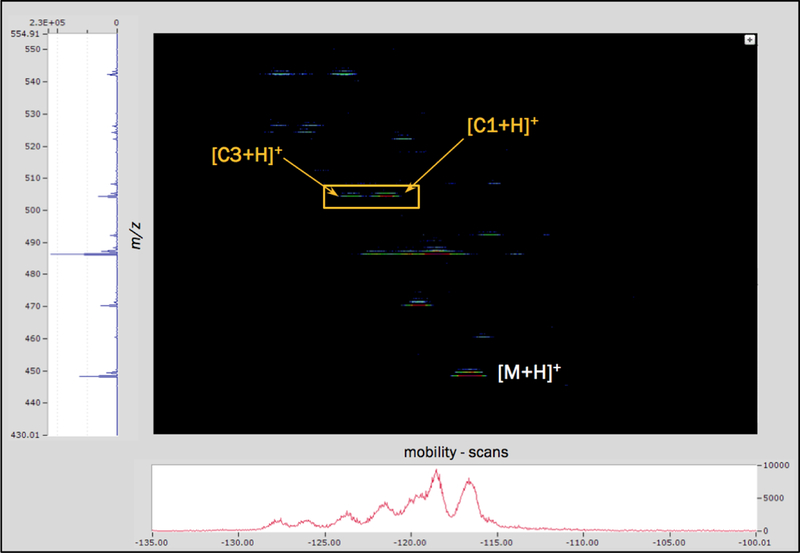
Heat map resulting from the TIMS-MS analysis of control (PFGK, [M+H]+), C1 (propionyl modified), and C3 (acrolein modified) peptide mixture. The heat map displays m/z, in Da, on the y-axis and mobility on the x-axis. The mass spectrum to the left of the heat map is the sum of all ions over the displayed mobility range and the mobility spectrum just below the heat map is the sum of all ions in the heat map over the displayed mass range. The heat map demonstrates the resolution of all 3 peptides in a single TIMS-MS analysis.