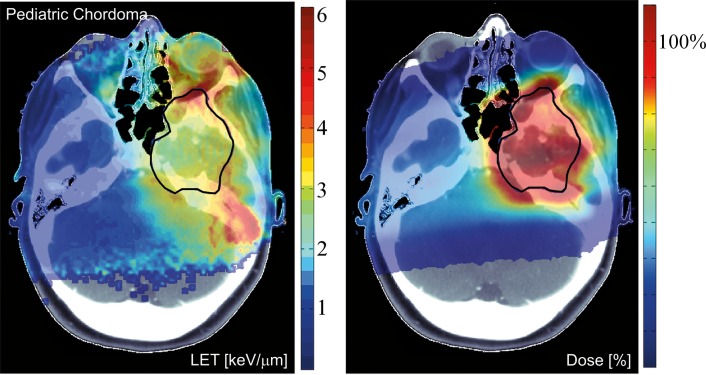
Figure 5.
Dose distribution and distribution of LETd for an intensity-modulated proton therapy treatment plan. The contour for the clinical target volume is shown in black. Left: LETd distribution in keV/μm. The LET distribution is a potential measure of biological effectiveness. Right: dose in percent of the prescribed dose. The figure uses dose and LET cut-offs at <0.1% of the maximum, respectively. See reference [48] for more details. Abbreviations: LET, linear energy transfer; LETd, dose-averaged LET.

