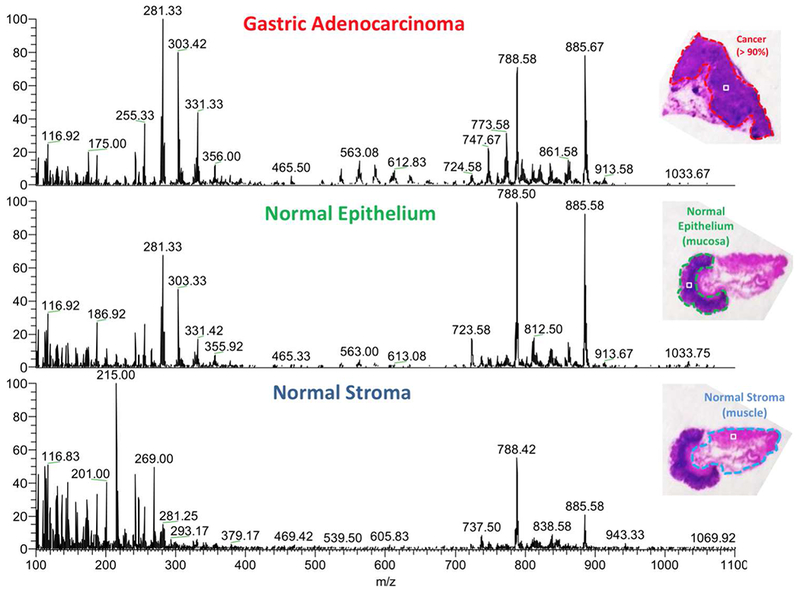
Fig. 2.

DESI mass spectra for one pixel taken from each region in the banked tissue example. The result of DESI mass spectrometric imaging is a 2D ion image with hundreds of pixels. Each pixel has an ion intensity measurement at each of thousands of mass-to-charge values, producing a mass spectrum. The three mass spectra in the image correspond to one pixel each. The objective is to classify a pixel as cancer or normal on the basis of its mass spectrum.
