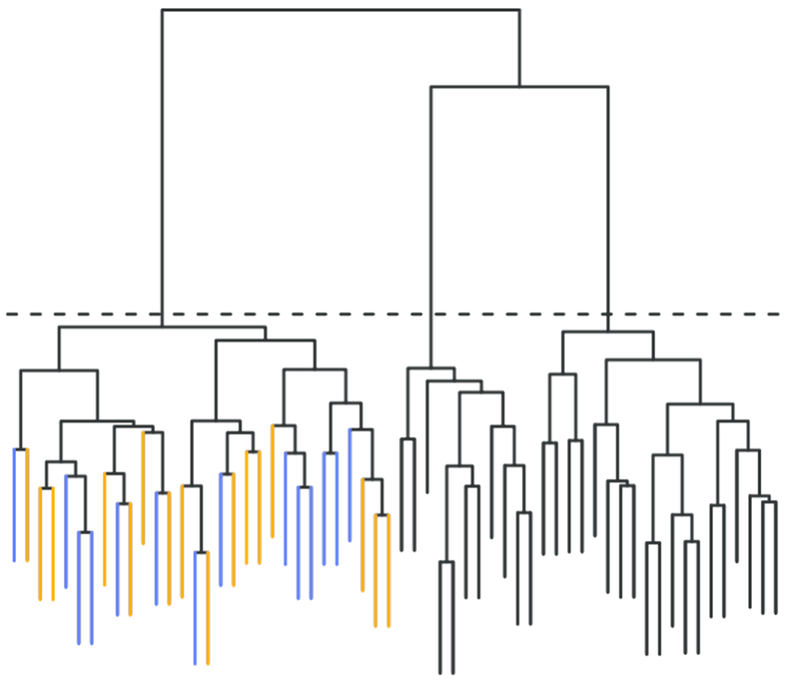
Fig. 3.

A dendrogram depicting joint clustering of training and test data, which is the method proposed for partitioning the test data and identifying customized training sets when the test data have no inherent grouping. Here the dendrogram is cut at a height to yield G = 3 clusters. Within the left cluster, the training data (blue leaves) are used to fit the model and make predictions for the test data (orange leaves).
