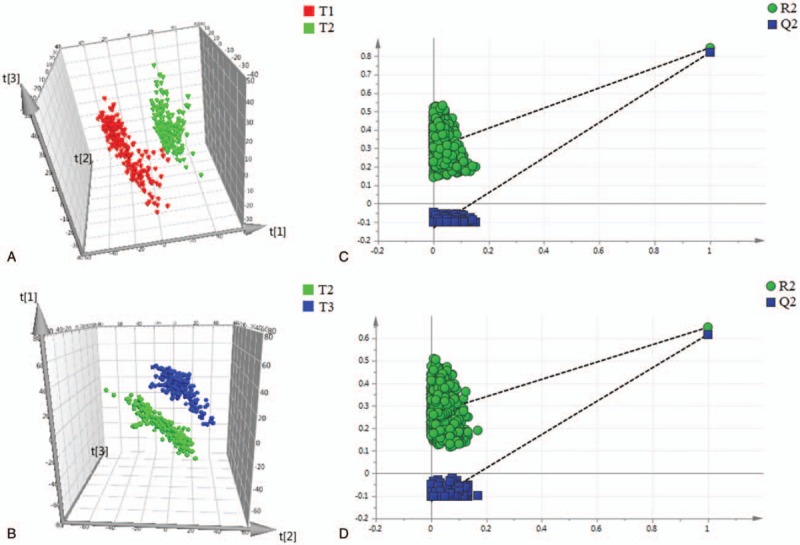
Figure 2.

Differentiation of urine metabolic profiles from healthy pregnant women obtained in negative ion mode using PLS-DA models. (A) PLS-DA analysis between the first trimester and the second trimester. (B) PLS-DA analysis between the second trimester and the third trimester. (C) 999 permutation test for the PLS-DA model of the comparison between the first trimester and the second trimester. (D) 999 permutation test for the PLS-DA model of the comparison between the second trimester and the third trimester. t[1], t[2], and t[3] denote the first component, the second component, and the third component, respectively. T1, T2, and T3 denote the first trimester, the second trimester, and the third trimester, respectively. PLS-DA = partial least squares discriminant analysis.
