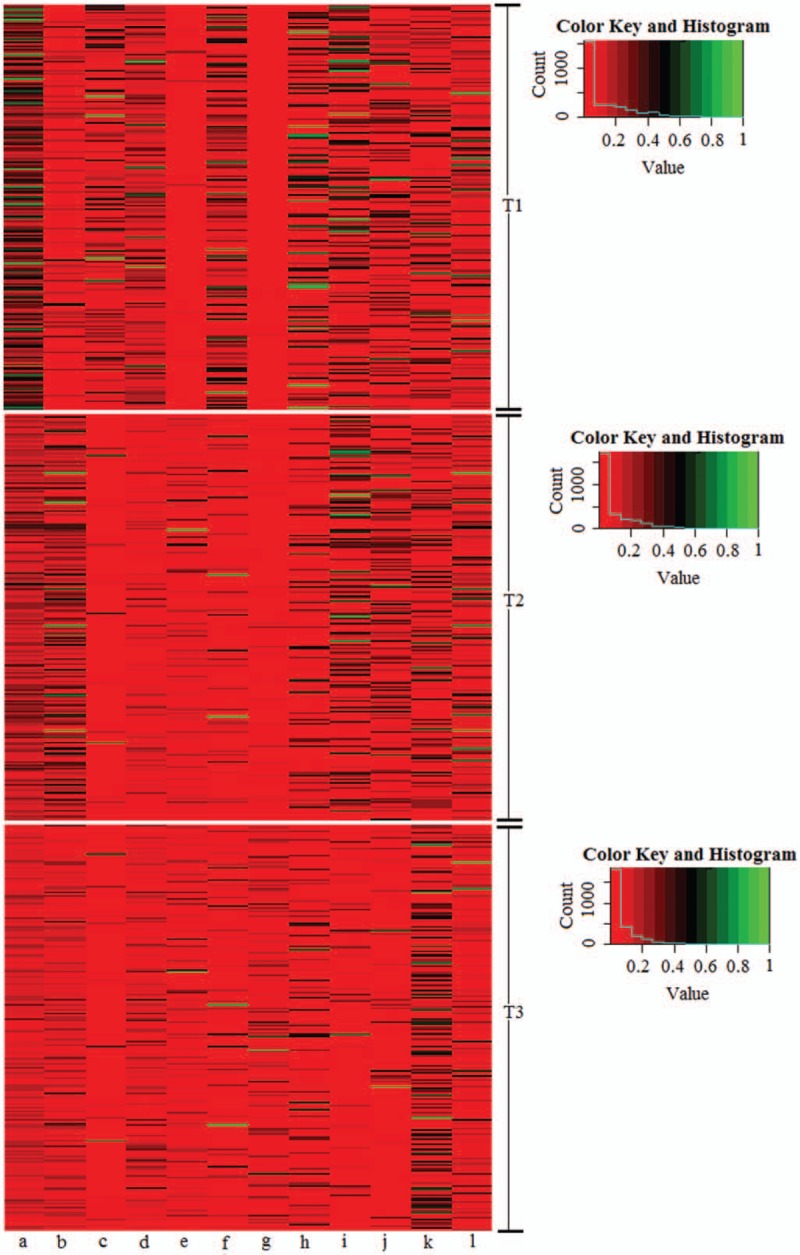
Figure 4.

Heat map of the relative concentration of significantly changed metabolites involved in glucose metabolism in different trimesters. T1, T2, and T3 denote the first trimester, the second trimester, and the third trimester, respectively. (a) l-Acetylcarnitine; (b) 2-phenylethanol glucuronide; (c) 1,4-beta-d-glucan; (d) 6-dehydrotestosterone glucuronide; (e) thiamine pyrophosphate; (f) d-glucuronic acid 1-phosphate; (g) glycochenodeoxycholic acid 3-glucuronide; (h) dolichol phosphate; (i) galactosylglycerol; (J) argininosuccinic acid; (k) 2-keto-glutaramic acid; (l) oxalosuccinic acid.
