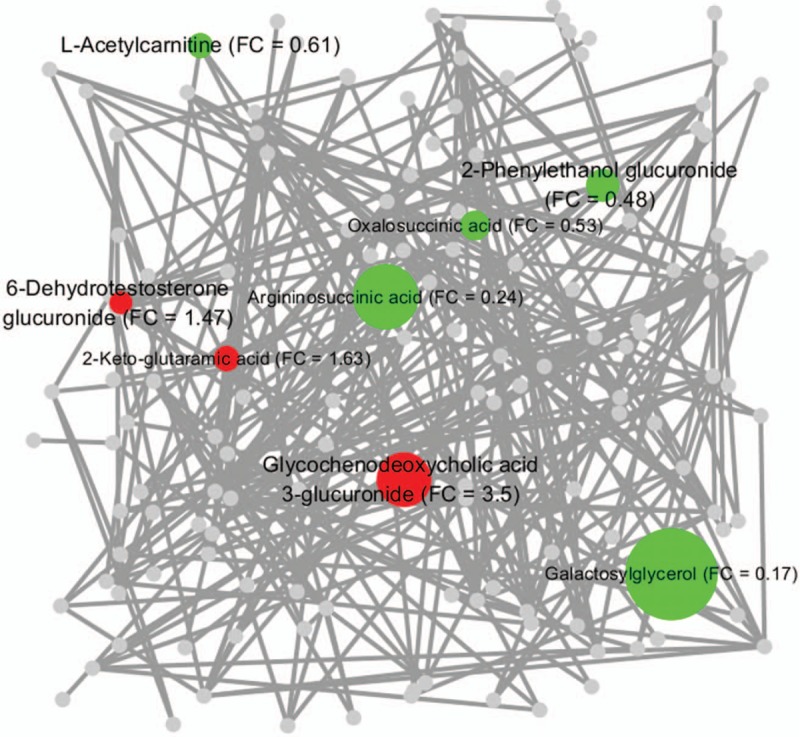
Figure 6.

Glucose metabolic network generated from the significantly changed metabolites in the third trimester (compared with the second trimester). The chemical similarity and KEGG biochemical interpretation of the intermediates involved in glucose metabolism were integrated into the network visualization in Cytoscape using the MetaMapp software. The red nodes denote the significantly elevated metabolites involved in glucose metabolism, the green nodes denote the significantly reduced metabolites involved in glucose metabolism, and the gray nodes denote the metabolites which were significantly changed in this study but not involved in glucose metabolism. The size of the colored nodes is coded by the corresponding fold change (FC) value. The network edges among the metabolites are defined by the thresholds of similarity scores (Tanimoto coefficients > 0.5). The nodes clustered closely have similar chemical structures and biochemical reaction modules.
