Figure 5.

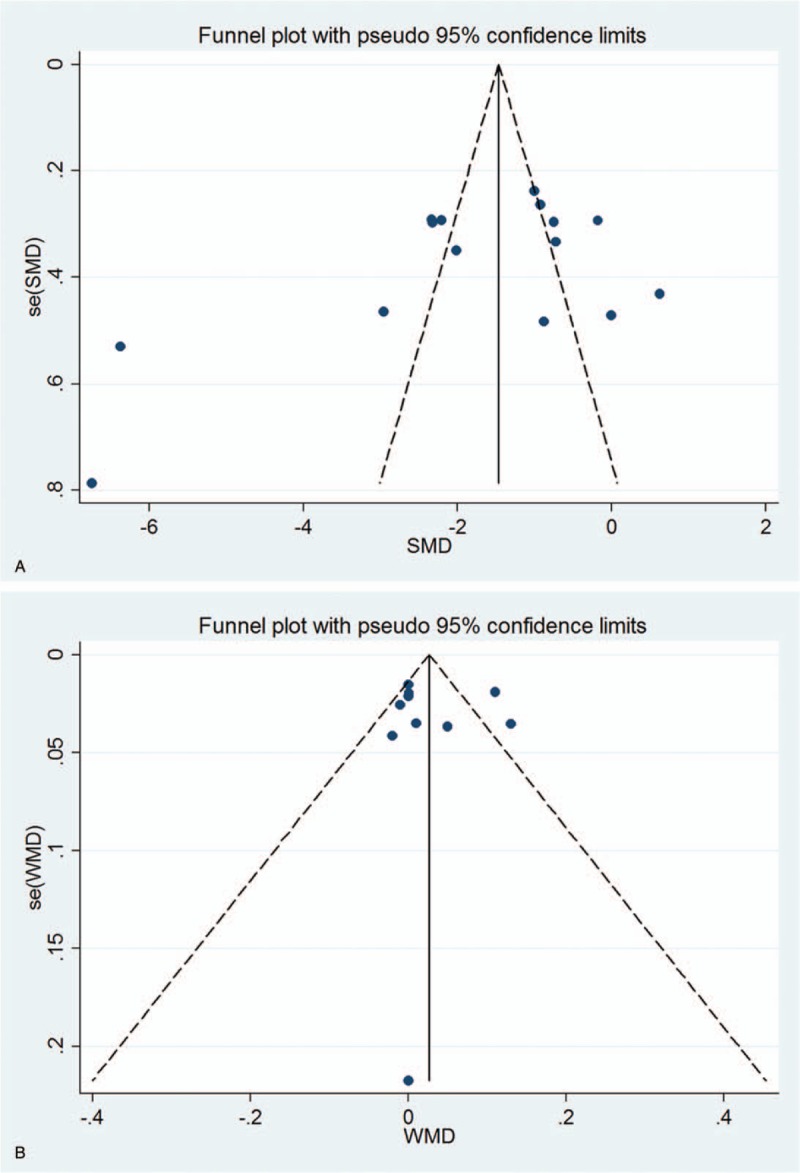
Funnel plot for publication bias test. Each point represents a separate study for the indicated association. (A) DCNVA; (B) CDVA.

Funnel plot for publication bias test. Each point represents a separate study for the indicated association. (A) DCNVA; (B) CDVA.