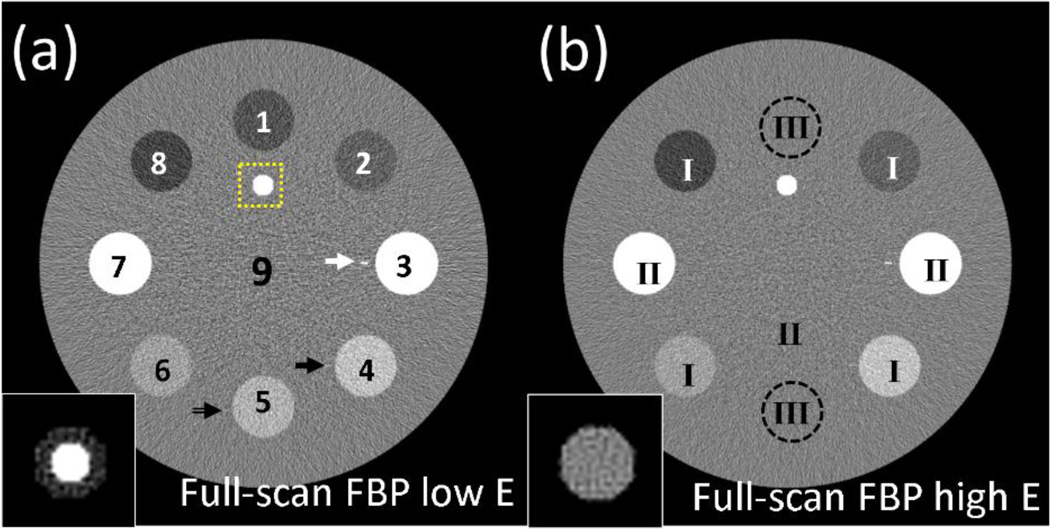
Figure 1.
CT images of a digital phantom reconstructed by full-scan FBP reconstructions at (a) low energy level, (b) high energy level. The labels in (a) are the indices of ROIs, and the labels in (b) indicate the different scenarios for each ROI. The dashed-line square in (a) indicates the region where the zoomed-in “vessel” at the bottom-left of each image is located. The black arrow, white arrow and double line arrow in (a) show the positions of line #1, line #2 and line #3 (corresponding to scenario I, II and III, respectively). Display window for full-FOV images is [−250 250] HU, and for zoomed-in “vessel” at bottom-left is HU, where is the mean HU value of the “vessel” in each case.

