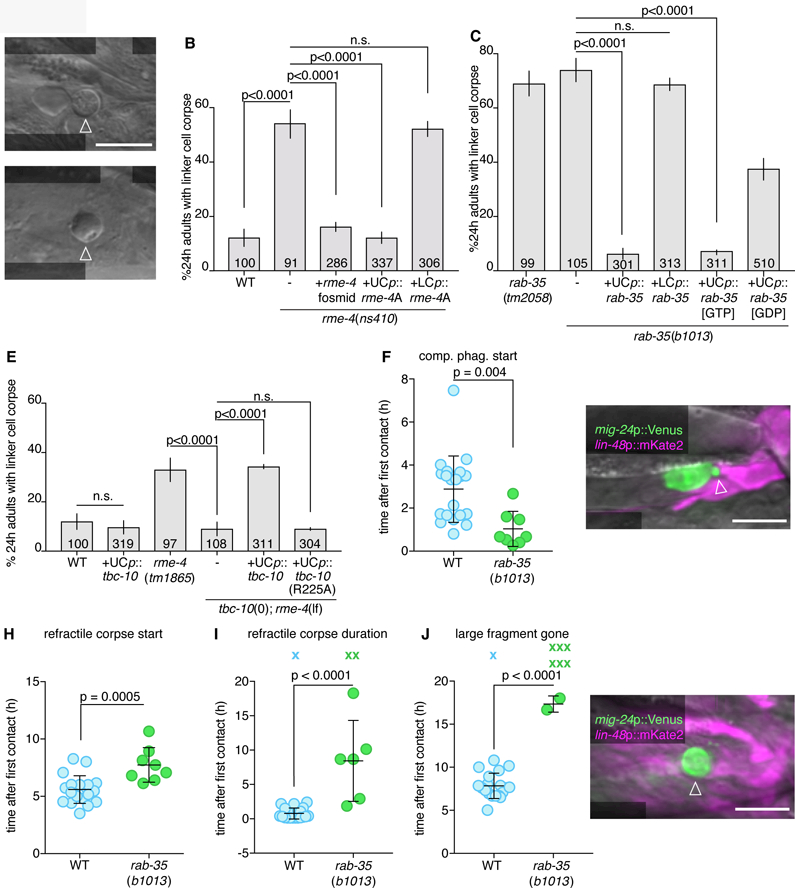
Figure 2. RAB-35, RME-4 (DENND1), and TBC-10 (TBC10D1A) regulate linker cell clearance.

(A) DIC image of persistent linker cell corpse (arrowhead) in rme-4(ns410). Scale bar, 10 µm. (B,C) Linker cell degradation in indicated genotypes. Strains contain lag-2p::GFP linker cell reporter and him-5(e1490). UCp, lin-48p. LCp, mig-24p. Number of animals scoredinside bars. Average of at least three independent lines. Error bars, standard error of the proportion or standard error of the mean. n.s., p>0.05, Fisher’s exact test. (D) DIC image of persistent linker cell corpse (arrowhead) in rab-35(b1013). (E) Histogram details as in (B). (F) Competitive phagocytosis onset in individual animals (circles). Bars, mean ± sd. Student’s t-test. WT, wild-type. (G) Arrowhead, early competitive phagocytosis in rab-35(b1013). Details as in Figure 1. (H-J) Quantification of linker cell events as in (F). X, Event persisting or not observed by end of imaging; not included in statistical analysis. (K) Arrowhead, persistent large cell fragment in rab-35(b1013). Strain and image details as in (G). See also Movie S3, Figures S2, S3, and Table S1, S4.
