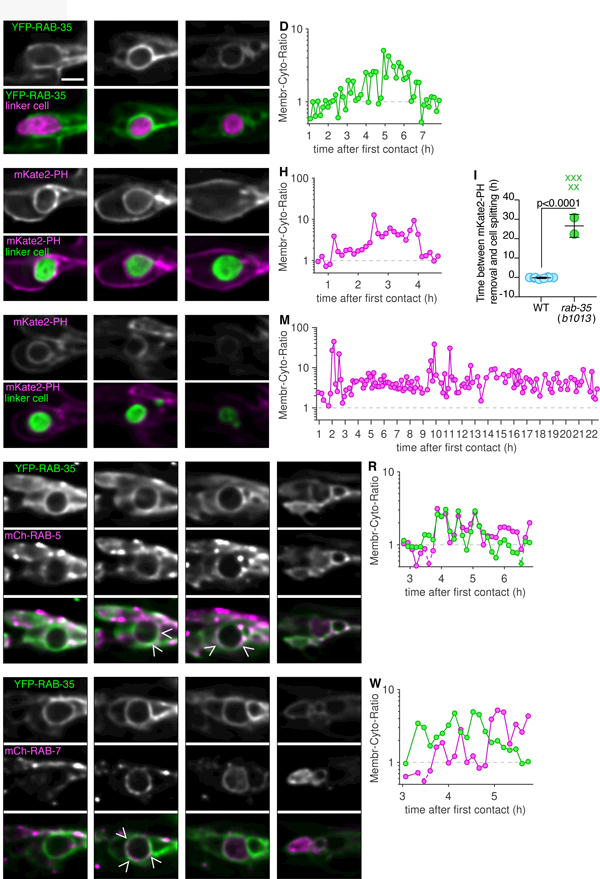
Figure 3. RAB-35 is required for PI(4,5)P2 removal and is enriched with RAB-5.

(A-C) Top: Localization of YFP-RAB-35 within U.l/rp cells. Bottom: YFP-RAB-35 (green), and linker cell (mig-24p::mKate2; magenta). Scale bar, 5 µm. (D) Ratio of average fluorescence intensity on phagosome membrane over the cytoplasm in hours after the first contact of animal shown in adjacent images. Logarithmic scale, where 1 indicates equal amount of cytoplasmic and phagosome membrane bound fluorescence. Any data point with a ratio below 0.5 indicated with a diamond and dotted line. (E-G) Same format as (A), except mKate2-PH imaged, and linker cell fluorescently labeled with YFP. (H) Same format as (D). (I) Timing of mKate2-PH removal in relation to linker cell splitting in individual animals (circles). Bars, mean ± sd. Student’s t-test. WT, wild-type. X, cell splitting occurred but mKate2-PH not removed and not included in statistical analysis. (J-L) Same format as (E) except in rab-35(b1013) animal. (M) Same format as in (D). (N-Q) Same format as (A), except mCherry-RAB-5 imaged, and linker cell not fluorescently labeled. Caret, site of colocalization. LC, linker cell. Asterisk, accumulation within phagosome. (R) Same format as in (D). (S-V) Same format as (A), except mCherry-RAB-7 imaged, and linker cell not fluorescently labeled. Caret, site of colocalization. LC, linker cell. Asterisk, accumulation within phagosome. (W) Same format as in (D). See also Figure S4 and Table S1.
