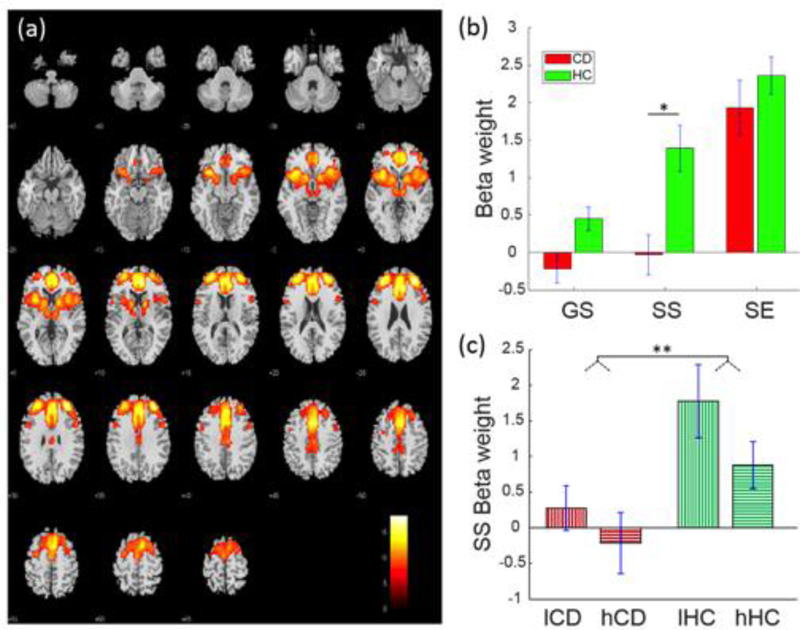
Fig. 1.

Fronto-striatal-thalamic network displaying a group difference in SS-related engagement (a) Spatial map of the brain regions positively integrated into the functional network displayed at P < 0.000001 (n = 110). (b) Beta-weights of GS, SS and SE trials each in CD and HC participants for the identified fronto-striatal-thalamic network. (c) Beta-weights relating to low and high SSRT subgroups each within the CD and HC groups. *p<0.05, **p<0.01, two-sample t test.
