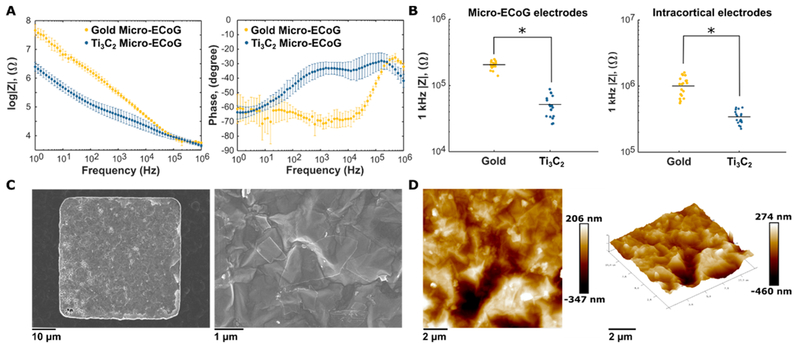
Figure 2.
Characterization of Ti3C2 neural electrodes. (A) Bode plots of impedance magnitude and phase for comparable Ti3C2 and Au micro-ECoG electrodes. Points represent means, and bars show standard deviations; Ti3C2 n = 10 and Au n = 10. (B) Scatter plots of 1 kHz impedance values for Ti3C2 and Au electrodes in micro-ECoG and intracortical electrode arrays. Micro-ECoG electrodes are 50 μm × 50 μm, and intracortical electrodes are 25 μm in diameter. For both types of electrode arrays, Ti3C2 shows an ~4× reduction in impedance compared to Au. Black bars indicate means. Micro-ECoG: Ti3C2 n =18 and Au n = 18. Intracortical: Ti3C2 n = 19 and Au n = 19. Single asterisks indicate p < 0.001 (C) SEM images of Ti3C2 electrodes. Individual Ti3C2 flakes are visible on the electrode surface. (D) AFM surface mapping showing the rough surface morphology of a Ti3C2 electrode.

