Figure 3.
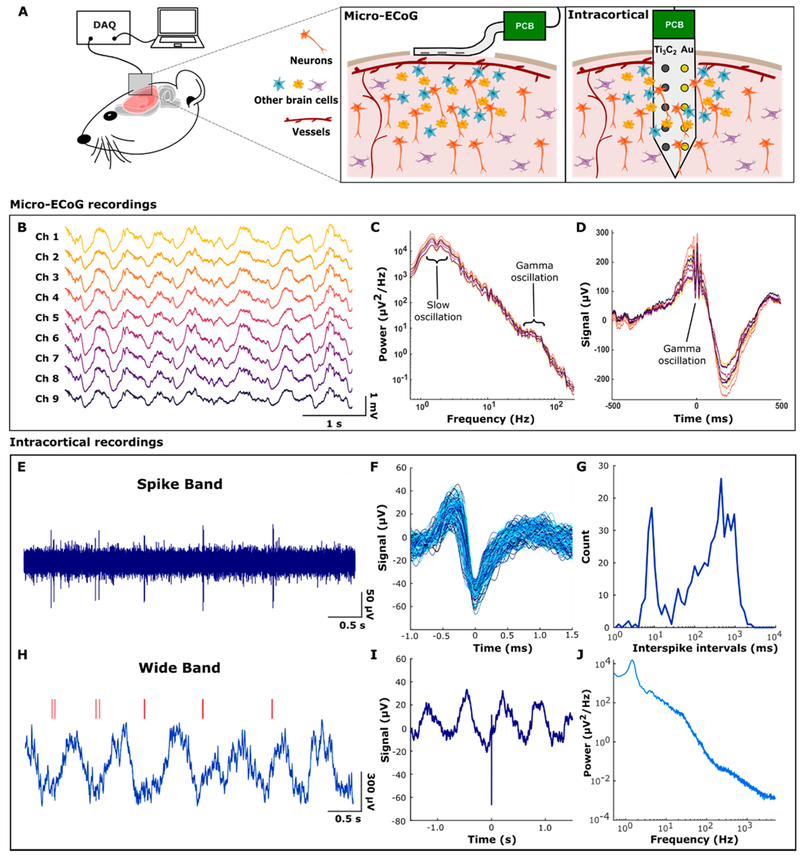
In vivo neural recordings with Ti3C2 MXene electrodes. (A) Schematic of in vivo neural recording with Ti3C2 electrode arrays. Ti3C2 micro-ECoG arrays were placed on the cortical surface after craniotomies were performed, and Ti3C2/Au intracortical arrays were inserted into the cortex through a burr hole. Devices were connected via a custom printed circuit board to the data-acquisition system. (B) Raw signals obtained from a Ti3C2 micro-ECoG device. (C) Power spectral density of micro-ECoG signals showing physiologic peaks for 1–2 Hz slow oscillations and 40–70 Hz γ oscillations. (D) The γ-triggered average showing γ oscillations coupled to the up phase of the slow oscillation. (E) Action potentials (spikes) recorded extracellularly in rat hippocampus under ketamine–dexmedetomidine anesthesia. Noise in the spike frequency band (500–5000 Hz) was 4.67 μVrms. (F) Overlaid spike waveforms (N = 580) from a 200 s recording. (G) Interspike intervals had a bimodal distribution. The neuron tended to fire rhythmically at 1 to 2 Hz with bursts of 2 spikes separated by about 10 ms. (H) The full bandwidth (0.5–5000 Hz) recording revealed that the rhythmic spiking was related to a slow oscillation in the field potential. Red lines indicate spike times corresponding to E. (I) Spike-triggered average showing that the spikes were locked to the rising phase of the slow oscillation. (J) Power spectrum of the full bandwidth recording with a physiological peak at 1.5 Hz.

