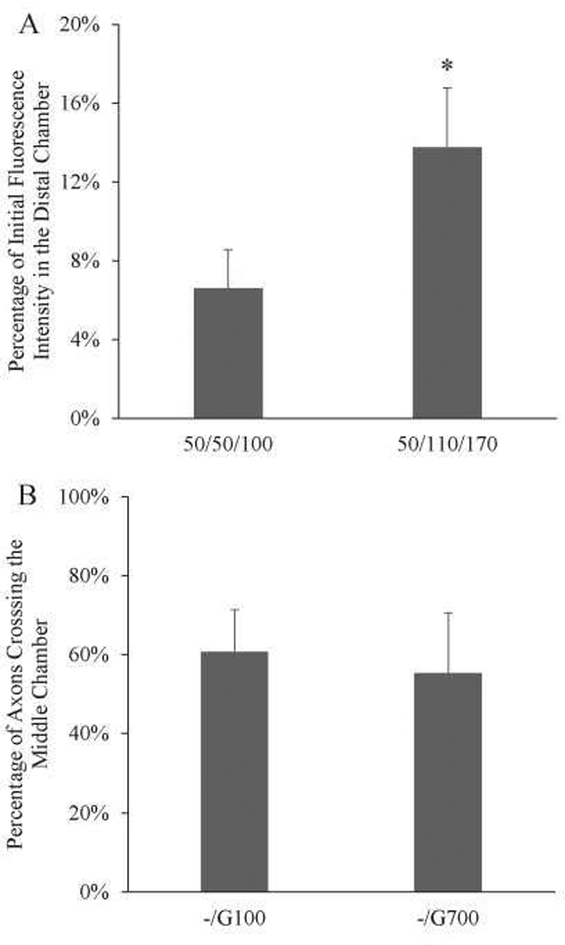
Figure 4: Microfluidic device shows controlled protein transport and robust axon crossing.
A) Varying the loading volume in each chamber changes the amount of protein transported. 50/50/110 correspond to the volumes in somal/middle/distal chamber in μL. With a volume increase in the distal and middle chamber, the amount of fluorescence increased more than 2-fold (6.6% to 13.8%). *: p<0.05 N=4. B) Quantification of axons crossing the middle chamber with different conditions. Both conditions showed robust axons crossing (-/G100 at 64.6%±10.7%, -/G700 at 55.3%±15.2%). N = 8.

