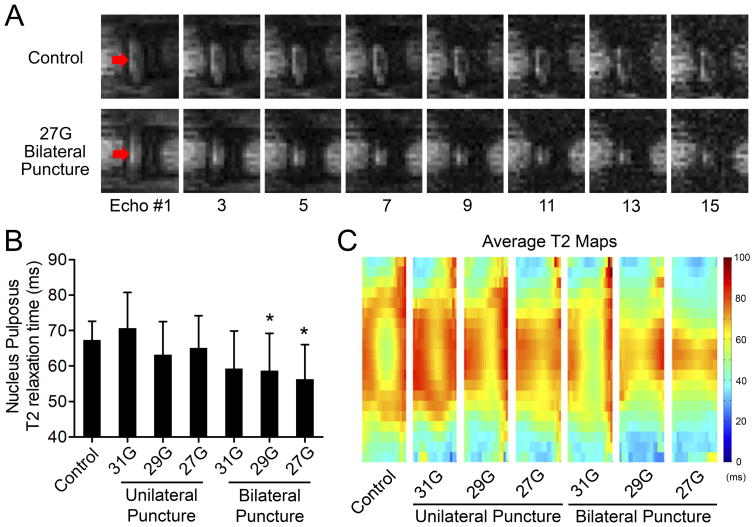
Figure 2.
Magnetic resonance imaging. A. Representative echoes illustrating T2 relaxation times for a control disc and a disc that received a bilateral injury with a 27G needle. Arrows indicate the location of the NP. B. Effects of injury type on NP T2 relaxation time. 29G and 27G bilateral AF puncture injury resulted in significantly lower T2 values compared to control (*p < 0.05, mean ± SD). C. Population average T2 maps for each experimental group. Note the relatively hypointense region within the central NP of the intervening control that likely reflects the cell dense notochordal remnant.

