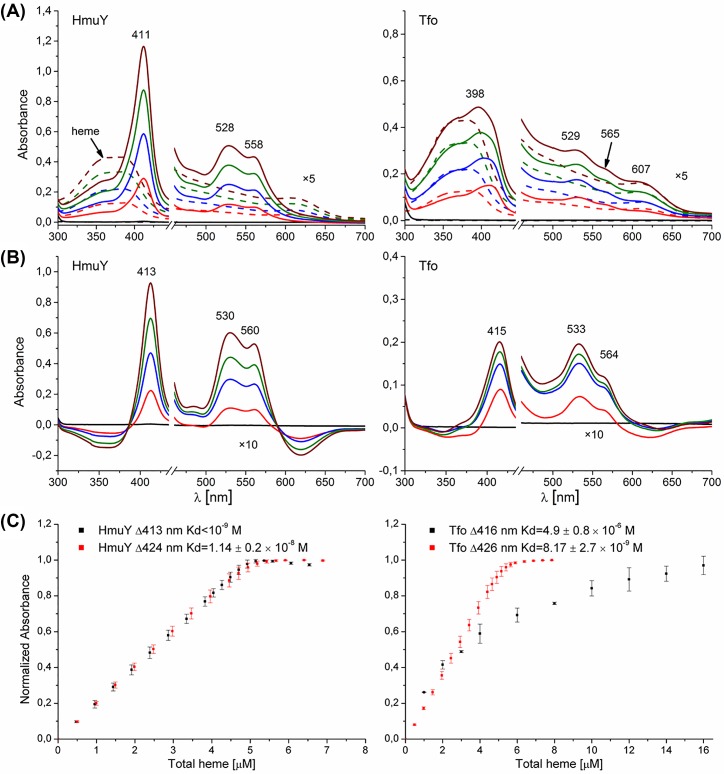
Figure 5. Heme titration experiments of P. gingivalis HmuY and T. forsythia Tfo.
UV-visible absorption (A) and difference (B) spectra of HmuY and Tfo recorded after titration of proteins (10 μM) with heme are shown. (C) The curves were generated after titration of 5 μM protein samples with heme by measuring the difference spectra between the protein+heme and heme-only samples. Samples were examined under air (oxidizing) conditions (black) or reduced by sodium dithionite (red). Results are shown as mean ± S.D. from three independent experiments.

