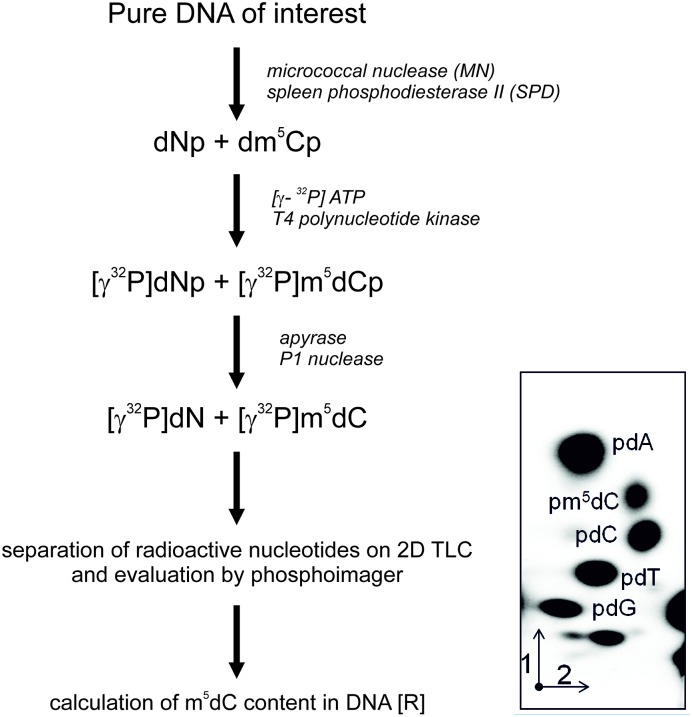
Figure 1. Flow chart of m5C analysis in DNA hydrolyzed to 3’-mononucleotides.
(Np, A - adenosine, G - guanosine, C - cytidine, T - thymidine). They are further labeled with [γ-32P] ATP, dephosphorylated of 3’ phosphate and separated with TLC in two dimensions (1 and 2). The chromatogram was evaluated with phosphoimager and the spots’ intensities were measured. These values were used for the calculation of the R coefficient according to the given equation [30,31].

