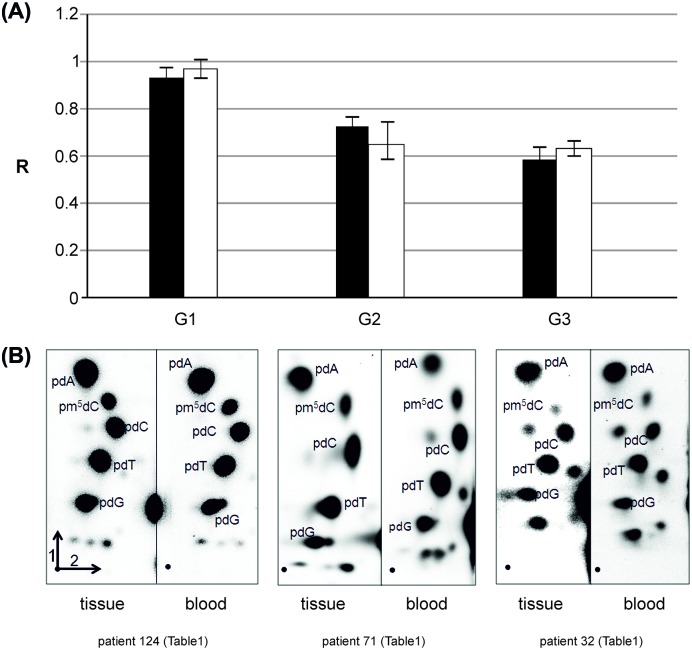
Figure 4. Comparison of m5C content in DNA of lung cancer brain metastasis and blood.
(A) Amounts of m5C in DNA (R) in tumor tissue (white bars) and peripheral blood (black bars) of the same subjects with brain metastases from lung cancer. The one way ANOVA test comparing R for tissue and blood samples was performed for the whole group (F=0.115 and P=0.735), and for G2 (F=0.494 and P=0.492), and G3 (F=0.668 and P=0. 420) grade. G1 subgroup for lung cancer consisted, in the case of comparison with blood sample, of one patient. (B) Results of 2D TLC analysis of global methylation in DNA from tumor (left pictures) and peripheral blood (right pictures) of the same sample patients with brain metastases form lung cancer in different grades, from G1 to G3 and from left to right, respectively. The first and second separation dimension are labeled on chromatograms. [γ32P] 2’deoxynucleotides derived fom DNA hydrolysis are labeled. Unmarked spots show ribonucleotides, commonly found contamination with RNA (unpublished).

