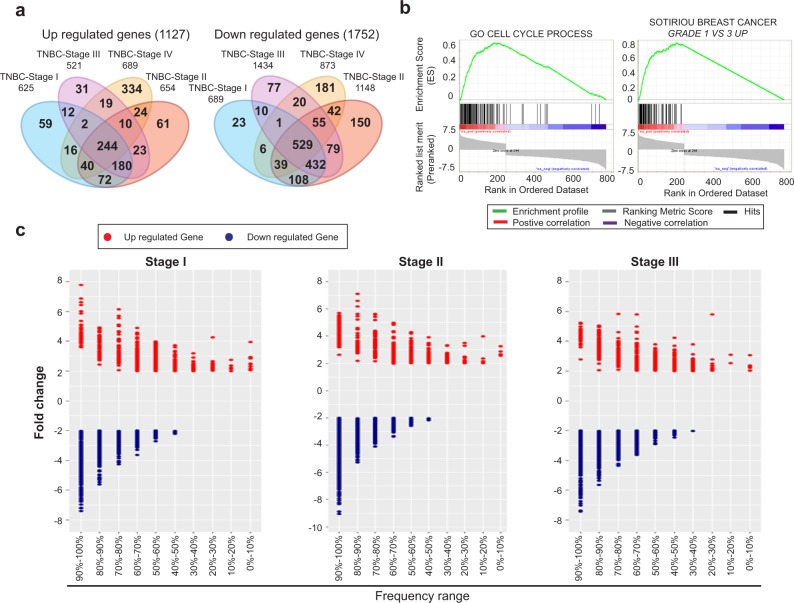
Fig. 1.
Identification of upregulated genes in TNBC. a Venn-diagram of differentially expressed genes in TNBC-stage-specific tumors. The number of up- and downregulated genes at each stage of tumor and at the intersection between different stages have been represented. b Gene set enrichment analysis for up/downregulated genes across all TNBC tumor stages. Gene Set Enrichment Analysis for 244 upregulated genes (left) and 529 downregulated genes (right) across four tumor stages along with previously identified, differentially upregulated genes from Sotiriou et al.29 c Frequency distribution of differential expression in TNBC-stage-specific tumors. Dot plot represents the fold-change and the frequency range of TNBC-stage-specific differentially expressed genes, where the red denotes upregulated gene and the blue denotes downregulated gene

