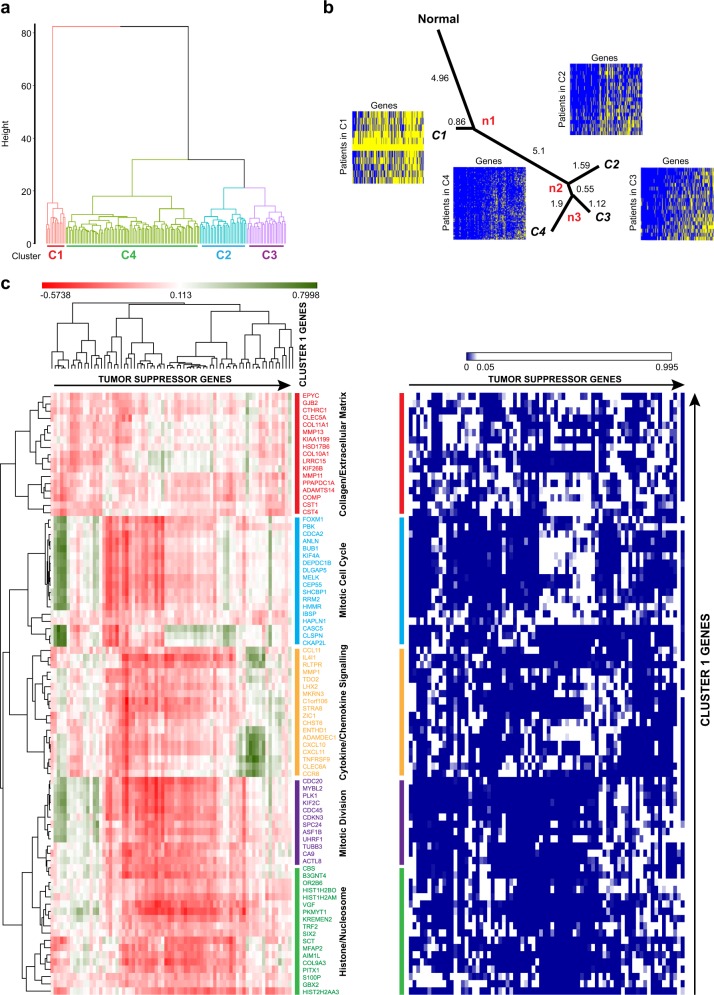
Fig. 3.
Identification of 83 upregulation events that occur in early stages. a Hierarchical clustering of 219 EEA genes in TNBC patients. Different colors show TNBC patients clustered into four clusters represented as Red for Cluster 1 (C1), Purple for Cluster 2 (C2), Blue for Cluster 3 (C3), and Green for Cluster 4 (C4). b The progression of gene upregulations in different TNBC clusters as shown by the phylogenetic tree. The figure shows the lineage of progression of gene upregulations from the normal to distinct subpopulations. Heat maps with genes in columns and TNBC samples in rows display the upregulation status (yellow: no upregulation; blue: upregulation) for different TNBC clusters. c Correlation clustergram of cluster 1 genes compared to known tumor suppressors. Red indicates negative correlation and green indicates positive correlation. The panel on the right represents, the significance of the correlation as a heat map. Blue indicates significance (<0.05) and white indicates lack of significance (>0.05)

