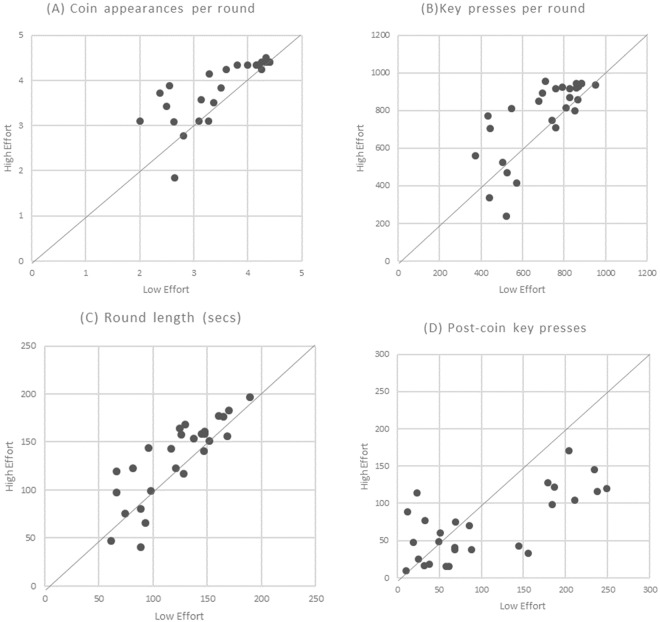
Figure 1.
Individual-level data. Each point represents one participant’s set of mean measures for selected variables for each of the two conditions: mean measure for High Effort condition is shown on the Y axis; mean measure for Low Effort condition is shown on the X-axis. A point on the 45° line indicates equality between the two measures; that is, if the mean of each of the participant’s measures did not differ between conditions. The variables shown are calculated separately for each condition and include: (A) Mean number of coin appearances per round; (B) Mean number of key presses per round; (C) Mean round length, in seconds; (D) Mean number of key presses after the final coin appearance within a round.

