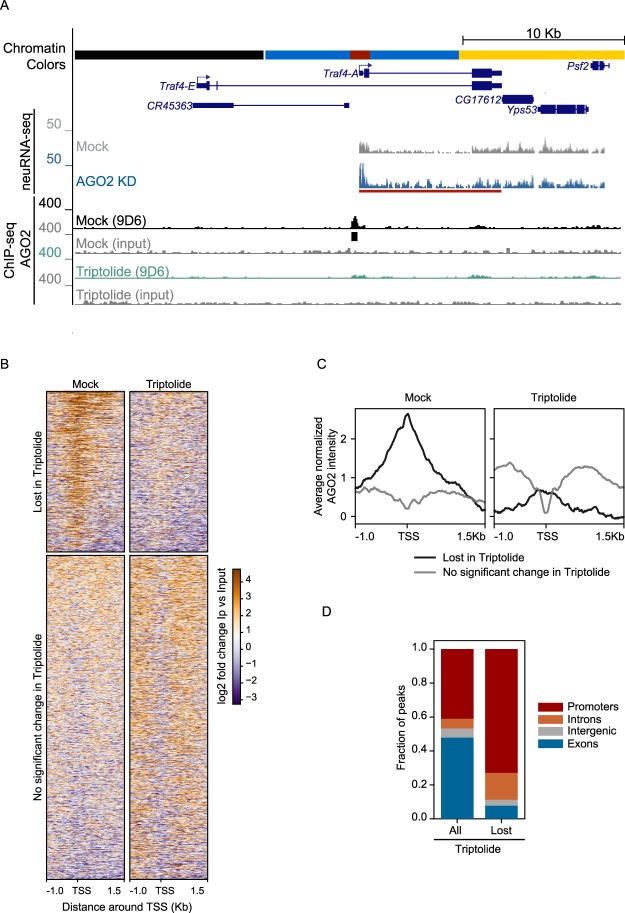
Figure 1.
AGO2 recruitment into chromatin depends on active transcription at a proportion of AGO2-bound promoters. (A) Screenshot showing an example AGO2-dependent gene Traf4-A, where AGO2 ChIP signal is lost upon addition of the transcription inhibitor Triptolide. Black bar corresponds to ChIP-seq peak. Red bar corresponds to significant neuRNA-seq transcriptional up-regulation upon AGO2 KD. Note that the active TSS is located within RED chromatin. (B) Heat map of AGO2 lost or unchanged peaks upon Triptolide treatment sorted by decreasing average ChIP-seq signal. (C) Metagene analysis for average normalized AGO2 ChIP-seq signal for sites in (B) near TSS under normal conditions or after transcription inhibition. Samples in the plot are combined replicates after normalization for library size and subtraction of paired input signal. (D) Relative distribution for all versus lost AGO2 peaks upon Triptolide treatment across different gene features using the following hierarchy: promoter > exon > intron > intergenic. Promoters are defined as TSS + 1500 bp.

