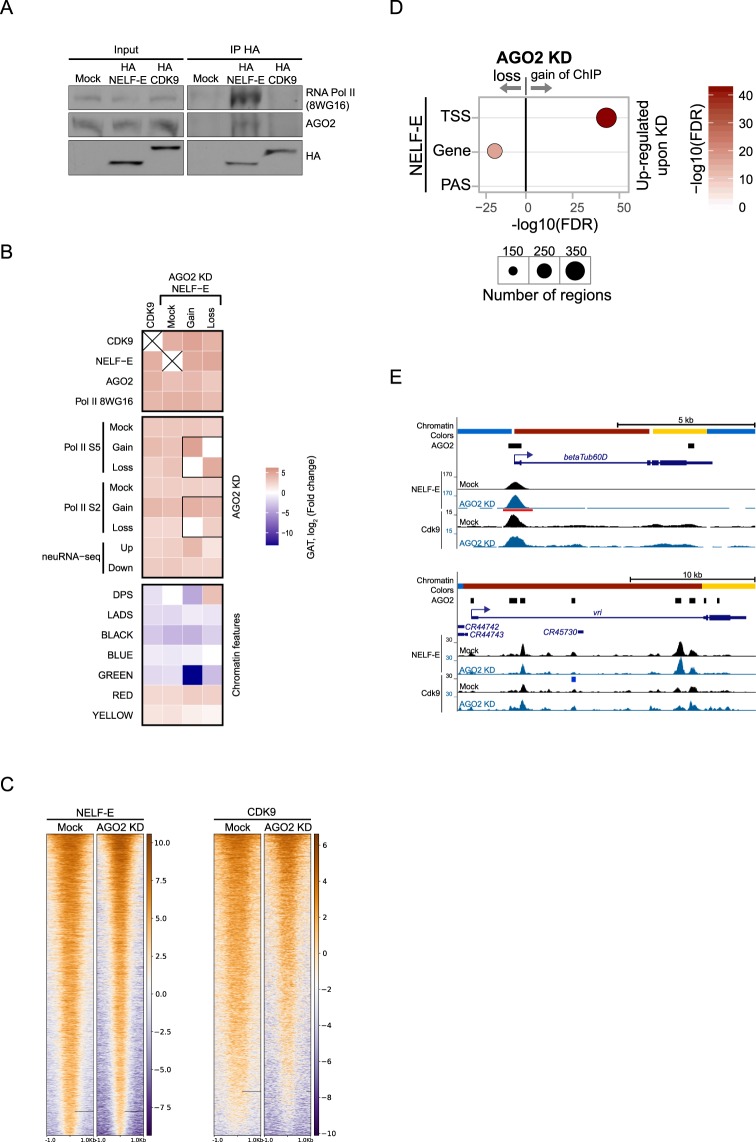
Figure 4.
AGO2 modulates NELF-E recruitment to affected genes. (A) Western blot showing co-immunoprecipitation of HA-NELF-E, AGO2, and Pol II from Kc nuclear extracts using monoclonal anti-HA antibody. HA-CDK9 does not co-immunoprecipitate AGO2 or hypophosphorylated Pol II. Representative western blots (cropped) are shown. (B) Heatmap showing enrichment and depletion of CDK9 and NELF-E ChIP-seq peaks across different factors, chromatin features, AGO2-affected elongating Pol II sites, and AGO2-affected neuRNA-seq genes. In addition, NELF-E differentially bound peaks upon AGO2 KD are included for comparison. Colormap represents the log2 fold change as reported by the Genomic Association Test (GAT), where negative (blue) indicates depletion and positive (red) indicates enrichment. Self-self comparisons are indicated by an X. (C) Heatmaps of NELF-E and CDK9 peaks in mock-treated cells or upon AGO2 depletion sorted by decreasing average ChIP-seq signal in respective mock-treated cells. The horizontal axis corresponds to distance from peak center for each analyzed factor. (D) Differential ChIP-seq analysis for NELF-E on neuRNA-seq up-regulated genes upon depletion of AGO2. Gene body is defined as any gene region that does not overlap with TSS or PAS (polyadenylation site). Size of circles indicates the number of total genes across the genome that display differential binding (see text for intersection values), and color indicates −log10(FDR) where FDR is the p-value from FETs adjusted for multiple comparisons. Only statistically significant results are shown for clarity. (E) Screenshot showing the example genes betaTub60D and vri, which are up-regulated in AGO2 knockdown. Their corresponding TSSes are located within RED chromatin. AGO2 ChIP peaks (black bars) and ChIP-seq signals of NELF-E and CDK9 are shown. Red and blue bars below signal tracks correspond to differential binding and statistically significant increases and decreases, respectively, in ChIP-seq signal relative to mock sample.

