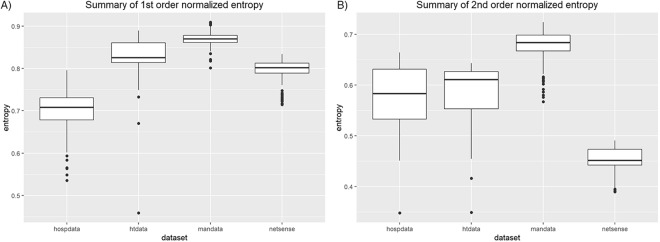
Figure 4.
Comparison of average value of normalized entropy obtained incrementally (measured in 50 equally distributed points in dataset period): (A) the first-order, (B) the second-order. X-axis labels: hospdata - dataset of hospital face-to-face contacts, htdata - conference face-to-face contacts, mandata - email communication in manufacturing company, netsense - student text communication. Boxes shows median (black horizontal line) with the 1st and the 3rd quartile. Points refers to outliers and vertical lines to range of main observations.

