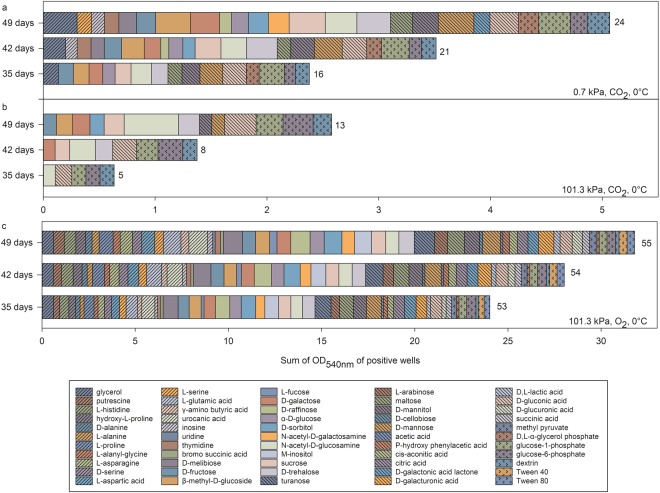
Figure 5.
Comparisons of substrate utilization patterns for Serratia liquefaciens cells grown at 0 °C under 0.7 or 101.3 kPa and under pO2 or pCO2. The OD readings were taken after 35, 42, and 49 d of incubation. The number at the end of each horizontal bar indicates substrate richness. The assay plates were incubated at (a) 0.7 kPa, CO2 atmosphere, and 0 °C; (b) 101.3 kPa, CO2 atmosphere, and 0 °C; or (c) 101.3 kPa, CO2 atmosphere, and 0 °C. The OD data represent average values of n = 3 replicates.

