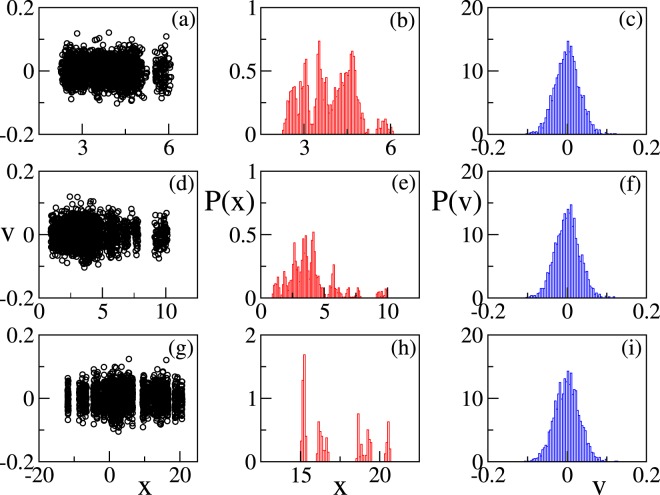
Figure 2.
Panels (a,d,g) Snapshots of the velocities of the single dipoles as a function of their positions for K = 0 (a), K = 0.1 (d), K = 1 (g). Panels (b,e,h) probability distribution of the positions of the dipoles for different coupling constants. The panels refer to K = 0 (b), K = 0.1 (e), K = 1 (h). Panels (c,f,i) probability distribution of the velocities of the dipoles for different coupling constants. The panels refer to K = 0 (c), K = 0.1 (f), K = 1 (i). The probability distribution functions are obtained by measuring the corresponding variables at regular time intervals δT during a long simulation, after discarding an initial transient time. Parameters as in Fig. 1.

