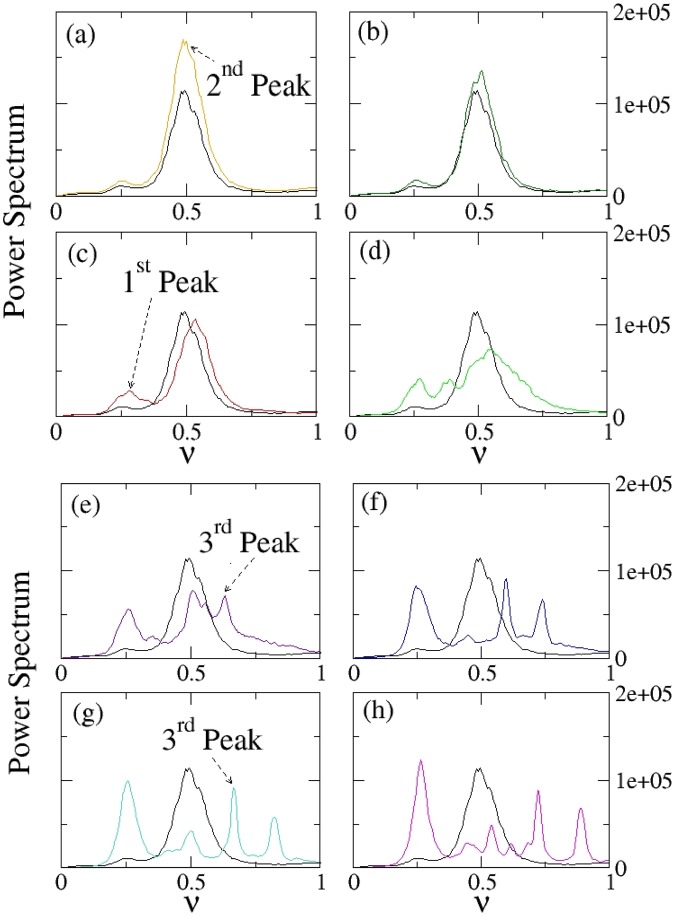
Figure 5.
Investigation of the emergence of a collective behavior as a characteristic peak in the power spectrum. Panels (a–h) Power spectrum of dP/dt for different values of the coupling constant K and for thermal noise strength = 0.46. The black curve represents, in each panel, the power spectrum of the system without coupling (K = 0). The other curves shown are, respectively, for K = 1 (a); K = 2 (b); K = 5 (c), K = 10 (d); K = 21 (e); K = 31 (f); K = 41 (g); K = 50 (h). The parameters values used for these simulations are: Ωi = 1, xi0 = 5, Ωfrict,i = 0.105 (for every i = 1, …, N), Ωpul = 0.1, , N = 50.

