Figure 5.
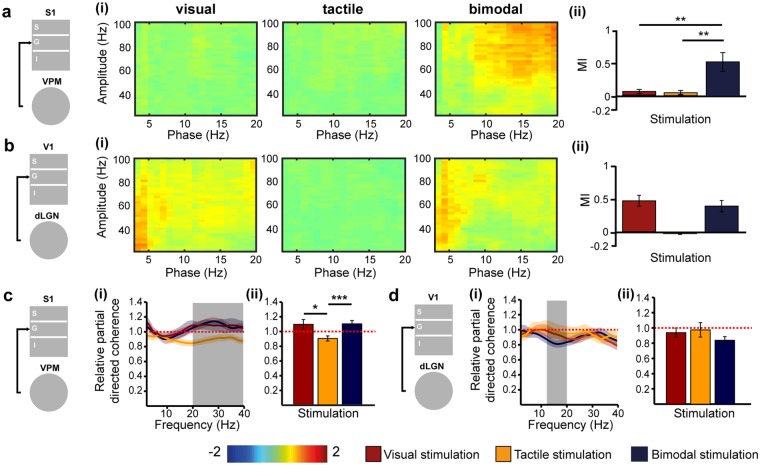
Thalamo-cortical phase-amplitude cross-frequency coupling and directed interactions after uni- and bimodal stimulation. (a) Schematic diagram of assessed coupling. (i) Heat maps displaying the relative (post-stimulation – pre-stimulation) phase amplitude cross-frequency coupling (CFC) between VPM and G layers of S1 after visual, tactile and bimodal stimulation. (ii) Bar diagram displaying the averaged relative modulation index (MI) for visual (red), tactile (orange) and bimodal visual-tactile (blue) stimulation. (b) Same as (a) for the coupling between dLGN and G layers of V1. (c) Schematic diagram of assessed directed interactions. (i) Plot displaying the relative partial directed coherence change (post-stimulus/pre-stimulus) 100–600 ms after unimodal visual (red), unimodal tactile (orange) and bimodal visual-tactile (blue) stimulation when assessed for 2–40 Hz oscillations in VPM and G layers of S1. (ii) Bar diagram displaying the relative partial directed coherence change (post-stimulus/pre-stimulus) 100–600 ms after unimodal visual (red), unimodal tactile (orange) and bimodal visual-tactile (blue) stimulation when assessed for the frequency range marked in (i) by the grey box. (d) Same as (c) for the information flow between dLGN and G layers of V1. Red dotted lines mark the border of an enhanced information flow (>1) or decreased information flow (<1.0). (*p < 0.05, **p < 0.01, ***p < 0.001; paired sample t-test).

