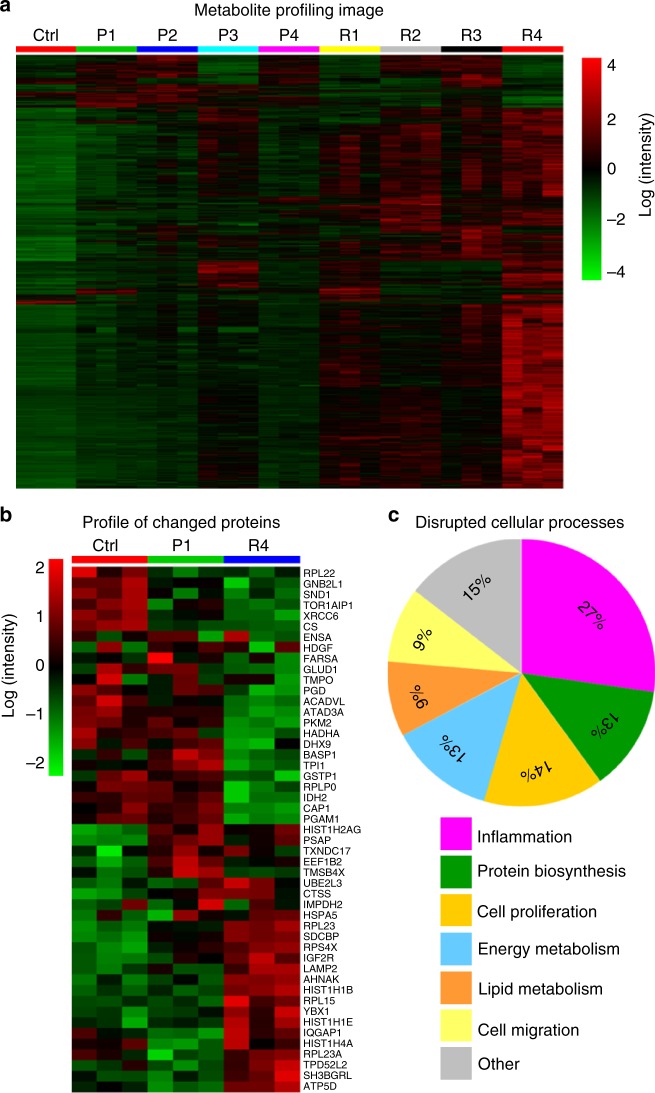
Fig. 2.
Fe2O3 induced metabolomics and proteomics changes and relationship. a Metabolite profile of THP-1 cells exposed to Fe2O3 library. After 24 h treatment, the cell samples (n = 3 independent experiments) were collected to extract proteins and metabolites. For metabolomics analysis, the log-transformed normalized peak intensities of metabolites in all the cell samples were expressed using red, black, or green colors in a heat map. b Fe2O3 nanoparticle-induced protein expression changes. For proteomics analysis, a heat map was plotted in a similar way as metabolites, showing 49 significantly changed proteins in proteomics analysis. c The pathways or bio-effects related with these proteins were determined by KEGG and UniprotKB database. The percentages of the differential proteins involved in each specific bio-effects of Fe2O3 were shown in the pie chart

