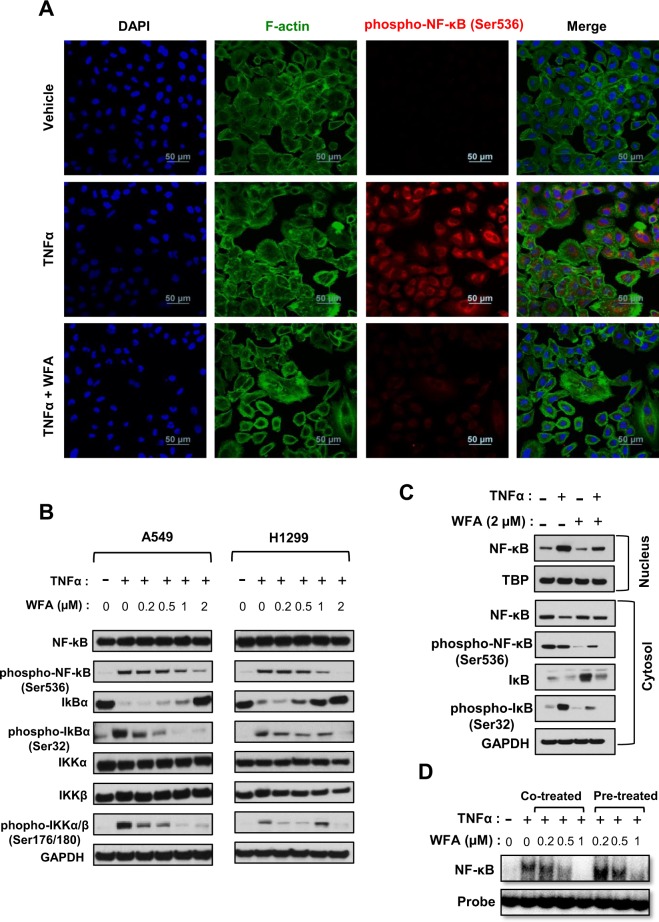
Figure 6.
Inhibition of TNFα-induced NFκB activation in human NSCLC cells. (A) Confocal images (40x magnification) showing the levels of p-NF-κB. (B) Western blot analysis depicting levels of p-NFκB, total NF-kB, p-IκB, and total IκB in whole cell lysates following stimulation with TNFα (25 ng/mL (C) Western blot analysis of nuclear and cytosolic cell extracts depicting levels of NFκB, p-NFκB, IκBα, and p-IκBα following stimulation with TNFα. (D) Electrophoretic mobility shift assay, indicating the inhibition of NF-κB binding to DNA. Cells were incubated with WFA for 4 h and then stimulated with TNFα (25 ng/mL). Band intensity represents the extent of DNA binding.

