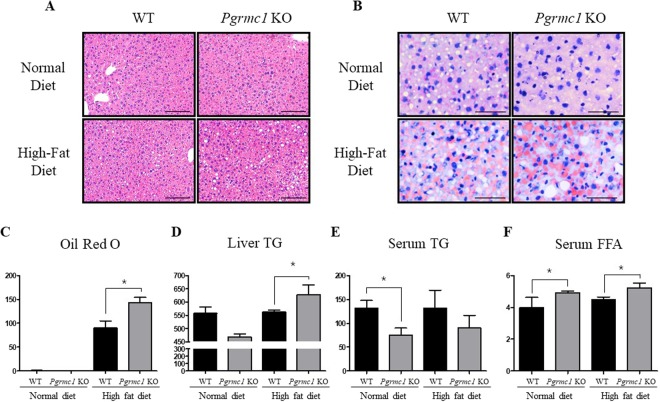
Figure 3.
Loss of Pgrmc1 increases hepatic TG accumulation. Normal diet and high fat diet were fed for 1 month to WT and Pgrmc1 KO mice. (A) Lipid droplets are characterized in H&E staining (Scale bar, 50 µm). (B) Oil Red O staining presents TG accumulation in hepatocytes (Scale bar, 25 µm). (C) Quantification of Oil Red O was analyzed by Image J as setting red cells for positive standard. (D) Total lipid from liver was extracted by folch method and level of TG was measured by colorimetric method in 550 nm. (E) Level of TG (triglycerides) in plasma showed inverse proportional level compared to liver TG. (F) Level of FFA in plasma was increased in Pgrmc1 KO mice. Values represent means ± SD. *P < 0.05. Number of mice used in experiment is at least 3 for each group.

