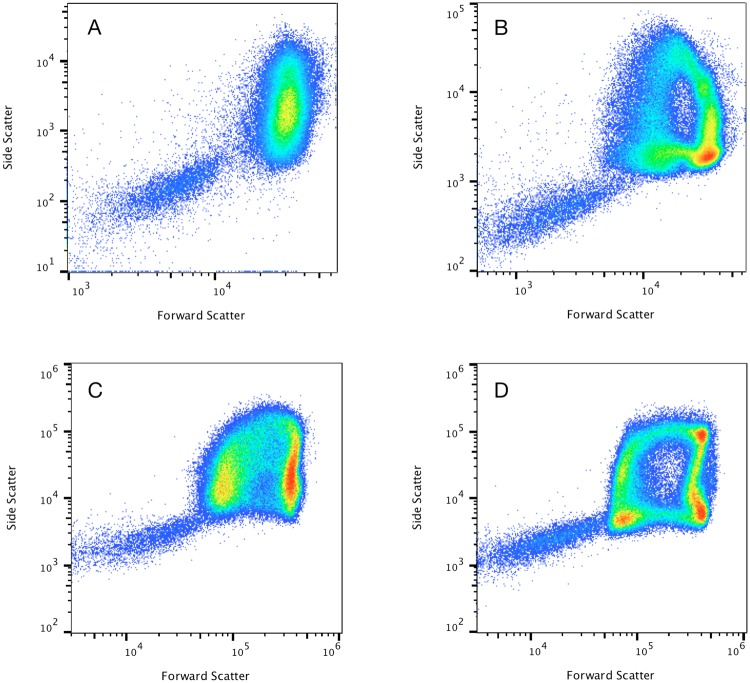
Figure 1.
Comparative effect of hydrodynamic focusing and acoustic focusing using unlysed diluted blood from a healthy subject. Representative population distributions for diluted whole blood showing red blood cells (RBCs) and platelets (PTLs) obtained with hydrodynamic instrument (A) (displayed in dotplot A) with hydrodynamic instrument (B) (displayed in dotplot B) with acoustic-assisted focusing turned off (displayed in dotplot C) and with acoustic focusing turned on (displayed in dotplot D). Forward scatter vs. side scatter dotplots display well-defined characteristic arch-shaped populations of erythrocytes only when acoustic focusing is turned on.

