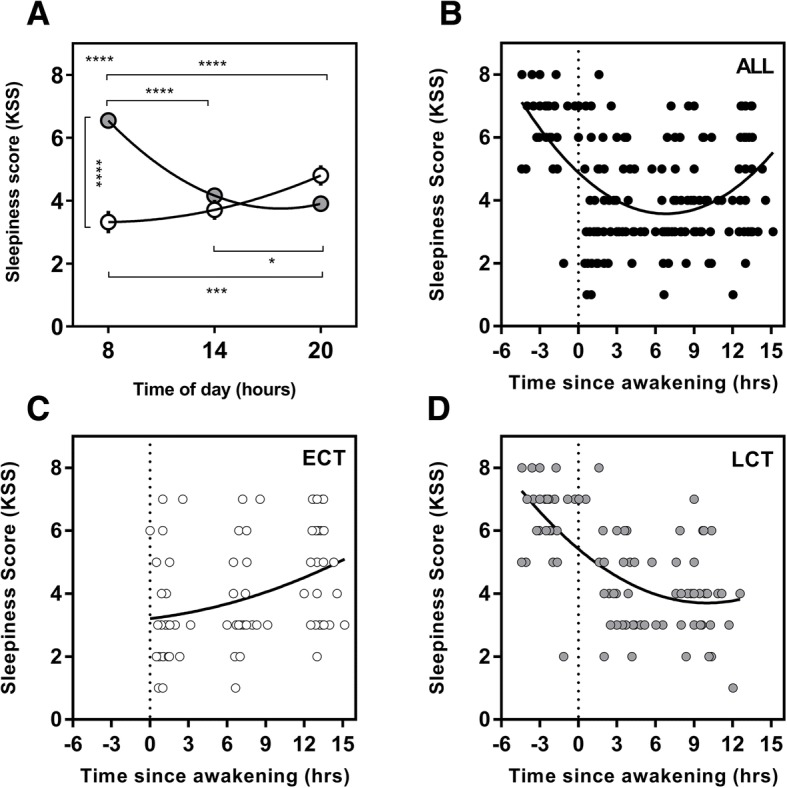
Fig. 1.

Diurnal variation in daytime sleepiness (KSS) and sleepiness as a function of time since awakening. Clock time variation (a) in KSS between ECTs (white circles) and LCTs (grey circles). KSS as a function of time since awakening for all subjects (n = 56; b), ECTs (n = 25; c), LCTs (n = 31; d). Entrained wake-up time, i.e. biological time 0, is shown with the dotted line. Curves are second-order polynomial non-linear regressions. The significance is shown as * = p < 0.05, ** = p < 0.01, *** = p < 0.001, ****p < 0.0001. The result shown in the upper left of (a) plots represents the interaction between the time of day and chronotype derived from the overall two-way ANOVA. Post hoc test results are shown with lines and asterisk between the time of day and chronotype groups
