FIGURE 8.

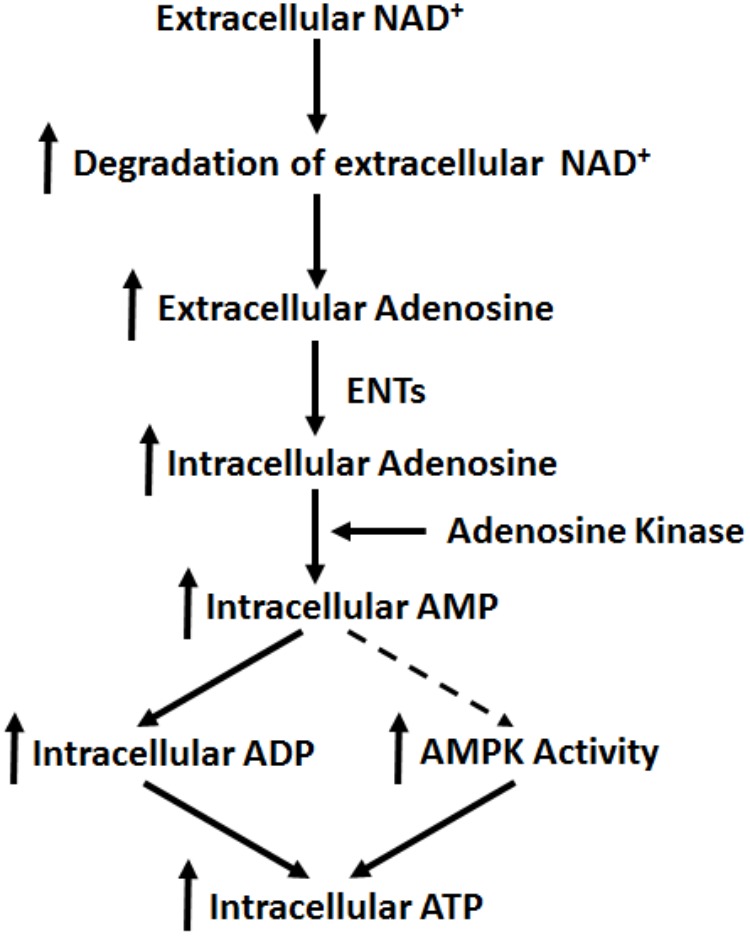
Diagrammatic presentation of the mechanisms underlying the effects of NAD+ on the intracellular adenylate pool of BV2 microglia under basal conditions.

Diagrammatic presentation of the mechanisms underlying the effects of NAD+ on the intracellular adenylate pool of BV2 microglia under basal conditions.