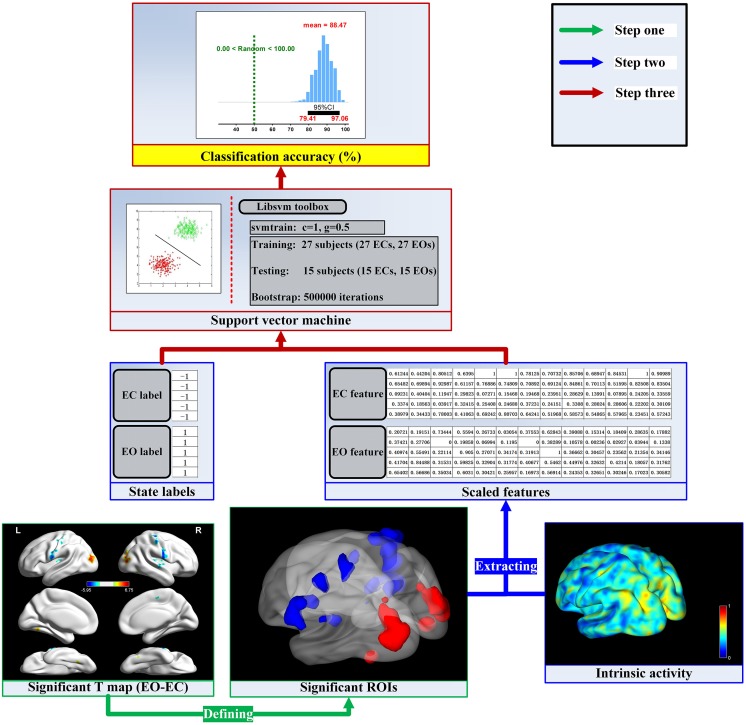
Figure 1.
The flow chart of the analysis stream. For the given dimension (e.g., regional homogeneity, ReHo), the activity values were calculated in a voxel wise manner. The first step was to find the significant brain activity and then define the significant regions of interest (ROIs) by the paired t-test and Gaussian random field (GRF) correction method. The next step was to extract mean activity values across voxels in each ROI and scale them into a range of 0–1. Finally, we established the linking model and obtained the sampling distribution of the classification accuracy.

