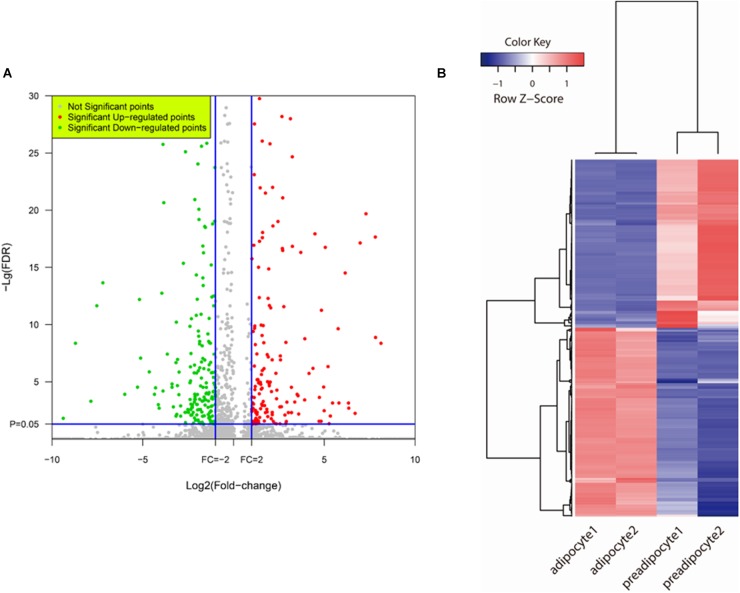
FIGURE 3.
DEGs detection. (A) Volcano plot of bovine adipogenesis related DEGs expression profiling. Red plots represent genes up-regulated significantly and green plots represent genes down-regulated significantly. (B) Heat map of DEGs. Hierarchical cluster and cluster tree analysis was used to create the dendrogram. The heat map compares fold change patterns of the most highly DEGs in preadipocytes and adipocytes. Each line represents one gene. Left two panels: adipocyte; Right two panels: preadipocytes. Red indicates high expression; blue indicates low expression.

