FIGURE 4.

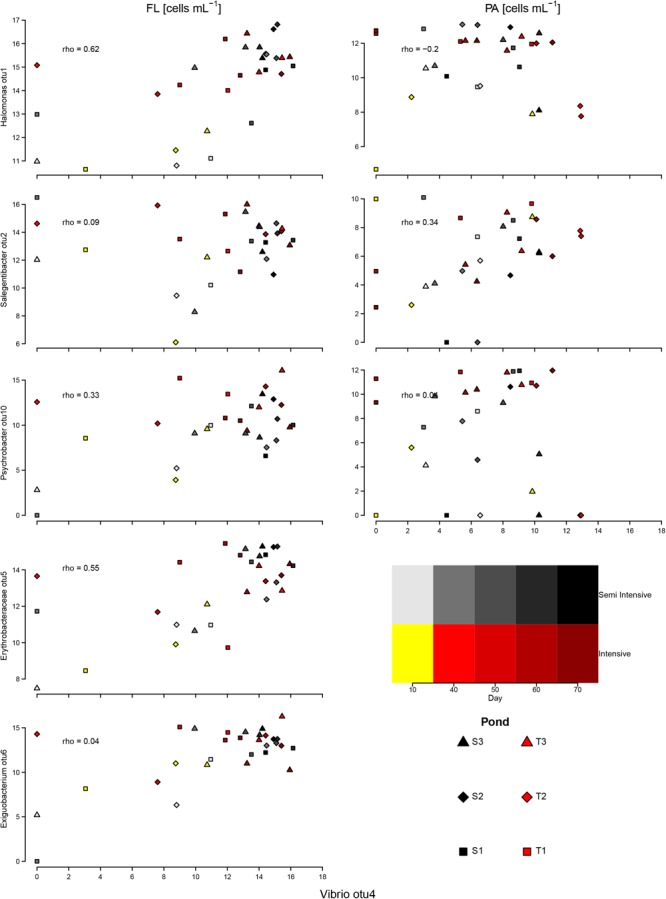
Correlation between estimated proportion of cells of the most-abundant OTUs in the FL and PA fractions and the dominant Vibrio OTU. The axes show log-transformed estimated bacterial numbers. rho, Spearman correlation coefficient.

Correlation between estimated proportion of cells of the most-abundant OTUs in the FL and PA fractions and the dominant Vibrio OTU. The axes show log-transformed estimated bacterial numbers. rho, Spearman correlation coefficient.