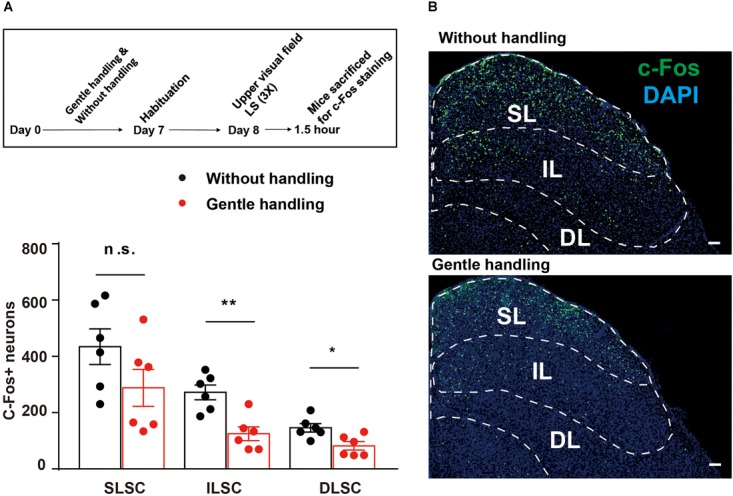
FIGURE 2.

(A) The timeline and bar graph showing reduced c-Fos expression in the gently handled group compared with the non-handled group in response to LS. (B) Representative images showing c-Fos expression in the SC of gently handled or non-handled groups in response to LS (SL, superficial layer of SC; IL, intermediate layer of SC; DL, deep layer of SC); Scale bars = 100 μm. Mann–Whitney U test, ∗∗P < 0.01, U = 2; ∗P < 0.05, U = 4.
