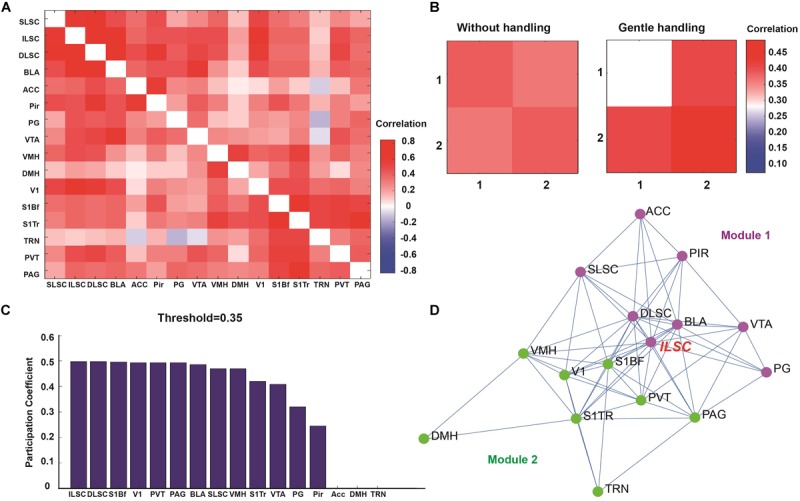
FIGURE 3.

(A) Correlation matrix showing the functional correlation among ROIs, SLSC (superficial layer of superior colliculus), ILSC (intermediate layer of superior colliculus), DLSC (deep layer of superior colliculus), BLA (basolateral amygdala), ACC (anterior cingulate cortex), Pir (piriform cortex), PG (pontine gray), VTA (ventral tegmental area), VMH (ventromedial hypothalamic nucleus), DMH (dorsal hypothalamic area), V1 (primary visual cortex), S1BF (primary somatosensory cortex, barrel field), S1TR (primary somatosensory cortex, trunk region), TRN (tegmental reticular nucleus), PVT (paraventricular thalamic nucleus), PAG (periaqueductal gray matter). (B) Two modules were classified by graph theoretical analysis. (C) Participation coefficients were calculated to determine the degree of each node connected to multiple networks. (D) Functional network nodes were exhibited by network visualization (module 1 is in purple, module 2 is in green).
