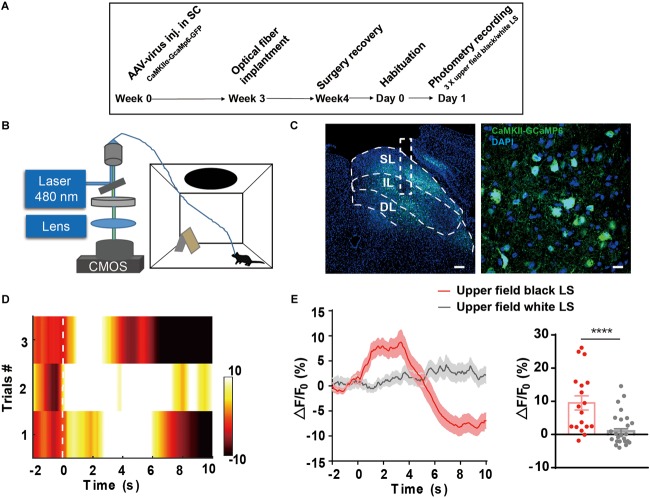
FIGURE 4.
(A,B) The timeline and schematic of fiber photometry recording of LS-induced Ca2+ transient. (C) AAV9-CaMKIIα-GCaMP6-GFP expression in the IL of the SC; Scale bars, left = 100 μm; right = 10 μm. (D) Representative heatmap exhibits LS-induced Ca2+ transient across three trials. (E) Mean GCaMP signal response to black looming in the upper visual field and white looming (n = 6 mice in black looming, n = 5 mice in white looming, ∗∗∗∗p < 0.0001, Mann–Whitney U test, U = 117).

