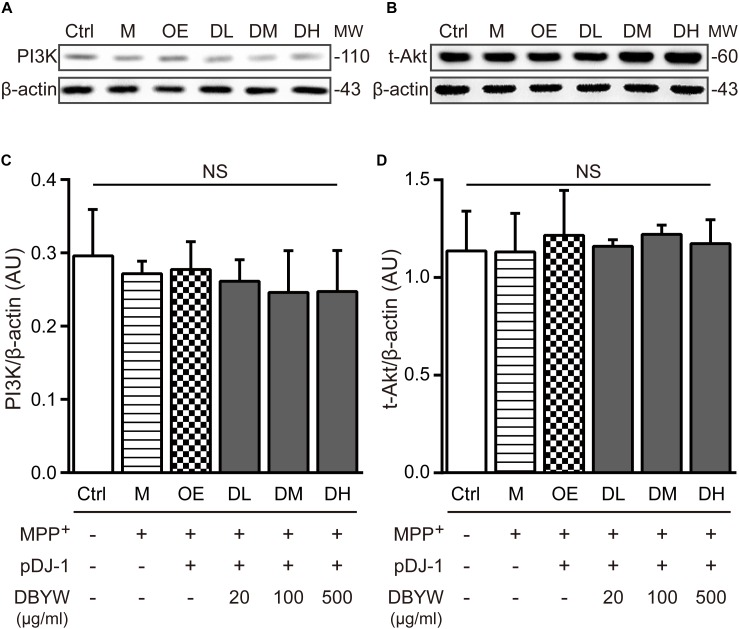
FIGURE 7.
PI3K and total Akt expressions detection. (A,B) Representative expressions for PI3K, total Akt, and beta-actin are demonstrated. (C,D) The graph shows the analysis in from three independent blots for the expression ratios of PI3K or total Akt, normalized to beta-actin. AU, arbitrary unit; Ctrl, the control group; M, the MPP+-treated group; MW, molecular weight (kDa); OE, the DJ-1 overexpression group; DL/DM/DH, DBYW low/medium/high dose groups; pDJ-1, the plasmid pDJ-1 transfection group; NS, not significant statistically.

