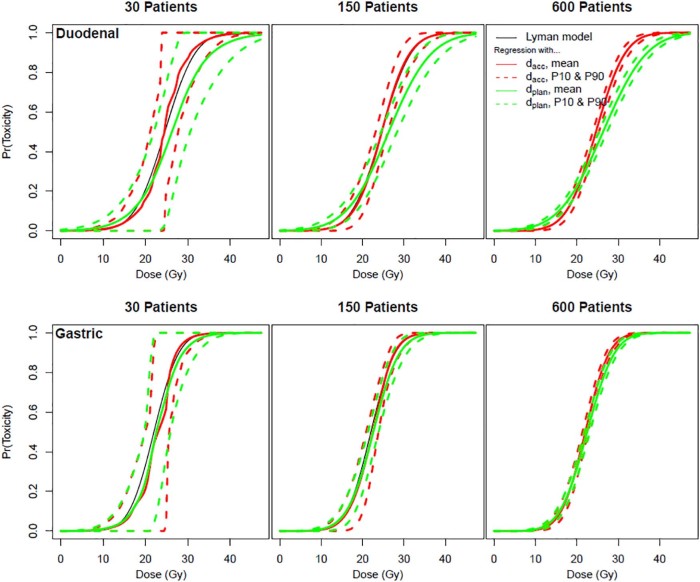
Figure 3.
Probability of the duodenal and gastric (with cirrhosis) toxicity. Probability for simulations of 30, 150, and 600 patients. The black line represents the Lyman normal tissue complication probability (NTCP) by dose. The solid red line represents the mean NTCP on the basis of simulations with accumulated doses (dacc). The green lines represent the mean NTCP on the basis of simulations with planned doses (dplan).The dashed lines represent the 10th and 90th percentiles.

