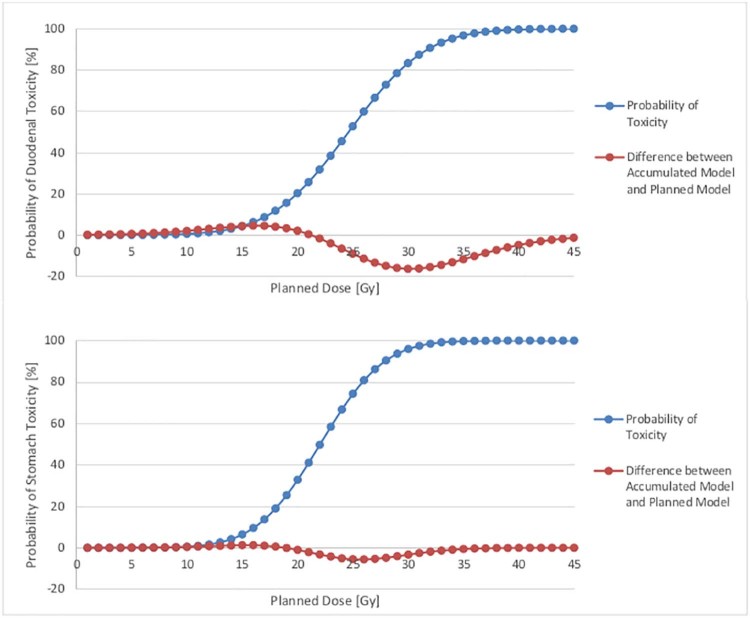
Figure 4.
Probability of duodenal toxicity (percentage; on the basis of accumulated model) for the duodenum and stomach. The blue line represents the probability of toxicity derived from the normal tissue complication probability model on the basis of accumulated versus planned doses. The orange line represents the difference between probability of toxicity using the accumulated and planned models. The largest difference for the duodenum occurs at a planned dose of approximately 30 Gy (toxicity risk of approximately 80%). The largest difference for the stomach occurs at a planned dose of approximately 26 Gy (toxicity risk of approximately 80%).

