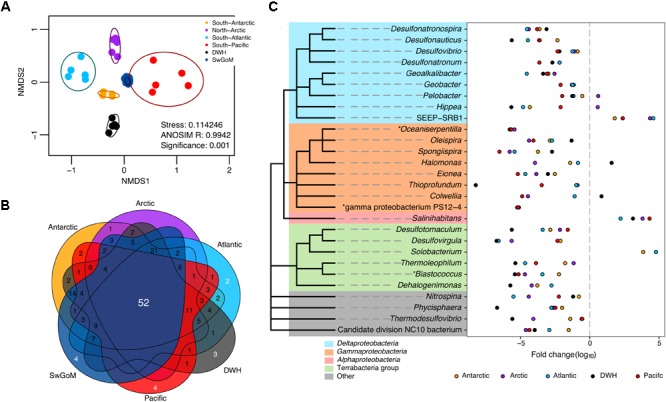
FIGURE 3.

Bacterial diversity and community structure comparison between projects from different sediments in distant geographical sites. (A) Nonmetric multidimensional scaling plot of the Bray–Curtis beta diversity estimated from the abundance matrix at the genus level. Ellipses indicate a confidence = 0.9. (B) Venn diagram comparing the “core” groups of each region with the “core” of the swGoM at the genus level (>1% abundance). (C) Fold change of genera identified as differentially abundant in the swGoM. The asterisk mark represents unique genera in the “core” of the swGoM >1% of abundance. Negative values indicate lower abundance with respect to the swGoM and vice versa. Cladograms represent taxonomic association among phylotypes; but branch lengths do not reflect phylogenetic distance.
