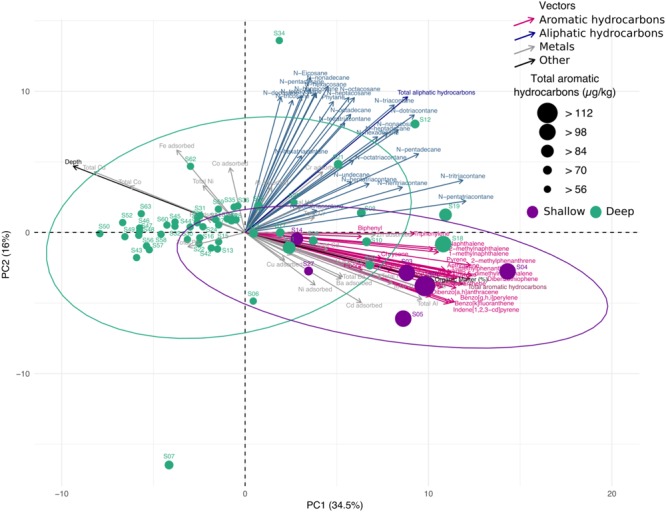
FIGURE 4.

Principal component analysis of abiotic variables measured in sediment samples from the swGoM. Ellipses indicate confidence = 0.9 in groups according to depth. Circle size represents the total aromatic hydrocarbon concentrations. Sample sediments from depths less than 500 m are shown in purple.
