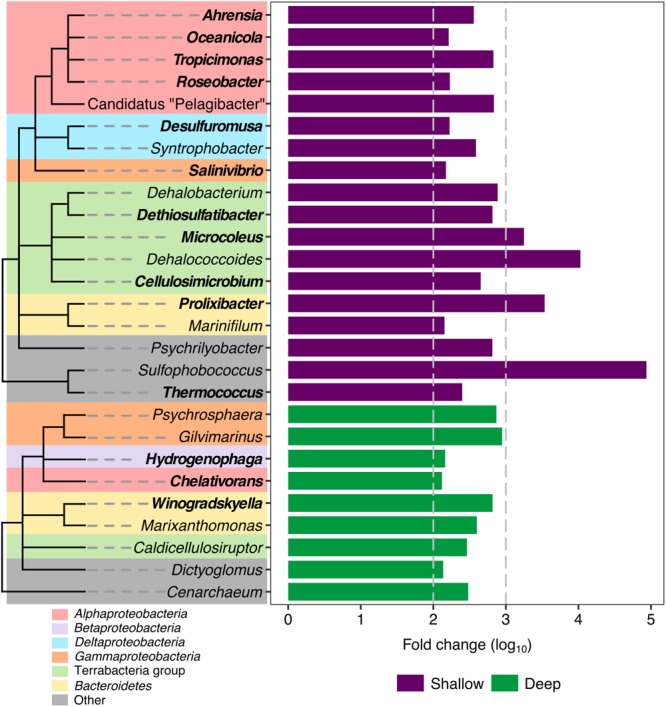
FIGURE 5.

Differentially abundant genera in shallow and deep samples from the swGoM. Bars represent the fold change abundance between deep (green) and shallow (purple) samples. Genera involved in hydrocarbon degradation are labeled in bold. Cladograms represent taxonomic associations among phylotypes; but branch lengths do not reflect phylogenetic distance.
